A Hands-On Tutorial with Reverse Traceroute
Internet paths are often asymmetric: packets from A to B usually take a different route than packets in the reverse direction from B to A. This post walks through a reproducible case study using Reverse Traceroute (RevTr) to compare forward and reverse paths for NDT speed tests.
Measurement Lab publishes new dataset of NDT7 measurements
A new dataset of ndt7 measurements is now available in BigQuery, offering access to measurements from a set of servers whose data had not been previously published.
IP Route Survey (IPRS) data published in M-Lab
We are excited to announce that the Dioptra research group at Sorbonne University is making its IP Route Survey (IPRS) available on M-Lab.
M-Lab is now providing Cloudflare AIM data for open access
Want to know more about your Internet connection? M-Lab is proud to announce that we are now publishing Cloudflare’s Aggregated Internet Measurement (AIM) dataset, which puts network quality in an end-user context.
M-Lab at SIGCOMM 2022
Measurement-Lab was excited to be represented at this year’s SIGCOMM conference with a tutorial and conference talk in the Best of CCR session. This post overviews M-Lab’s activities at SIGCOMM and includes references for the tutorial materials.
M-Lab Hackathon at IMC - Register by September 23rd!
Come analyze Internet performance data with M-Lab at ACM Internet Measurement Conference 2022!
Release notes for Unified Views with exposed Row Filters
Monday August 15th we will be updating the NDT unified views to provide researchers with access to the row filter logic used to exclude rows that are not believed to be representative measurements of network performance. This change enables interested researchers to better understand MLab’s data filtering and to easily craft alternate filters to verify our assumptions, or to filter data to address questions other than network throughput.
ARC of Research pt. 2: Exploring Data Sources Relevant to Our Questions
In this second “analysis recommendations in context” post, we will explore the refined research questions from the first post, resulting from our discussion of how to design specific questions with understanding of available data source(s) and the context of what each contains. We emphasized the importance of selecting a data source that matches the goal of the research question. This is critical for analyses of broadband measurement data, particularly when the research goal is to compare the results to one another, to national broadband standards or specific funding requirements, or to align with advertised terms of ISP service.
Analysis Recommendations in Context - ARC of Research pt. 1: Asking the Right Questions
A while back, our team published some analysis recommendations for anyone working with our data from the Network Diagnostic Tool (NDT), comparing it to other Internet measurement data sets, and drawing conclusions or inferences about the data. These recommendations are intended to provide guidance about analyzing crowdsourced data, because we know that it’s easy for analyses to end up with what looks like a striking comparison or finding, but that may not actually be supported by the underlying measurements or data. But because recommendations are only that, we’re now beginning a series of posts to unpack those recommendations with some context and examples. First, we’ll recap our previous recommendations post with more context, and finish with an example that we’ll continue working with in subsequent posts.
Exploring NDT Data by Geography in Baltimore City
Baltimore Data Day is an annual conference bringing together “community leaders, nonprofit organizations, government and civic-minded technologists to explore trends in community-based data and learn how other groups are using data to support and advance constructive change.” This year the 11th annual event expanded to become Baltimore Data Week, celebrating the 20th anniversary of the conference’s host organization, the Baltimore Neighborhood Indicators Alliance (BNIA). As a Baltimorean myself, I was honored to be invited to give a talk about the M-Lab platform and our open data, on the conference’s “Digital Inclusion Day.”
Measurement Observations on Network Performance During the COVID-19 Pandemic in Northern Italy
OONI was recently invited to participate in a NetGain Partnership webinar (titled “Surging Demand and The Global Internet Infrastructure”) to discuss the changing landscape for internet infrastructure and technology in the wake of the COVID-19 pandemic.
As part of our preparation for this webinar, we looked at network performance measurements collected from northern Italy over the last months (i.e. when Italy was hit hard by the COVID-19 pandemic) in an attempt to understand whether and to what extent there was a correlation between increased internet use and reduced network performance. As our observations may be of public interest, we decided to share them through this blog post.
Long Term Supported Schemas Using Standardized BigQuery Columns
Following the M-Lab platform upgrade in Nov. 2019, the development team began a series of follow up projects to enable access to NDT data for various audiences with differing needs. The first step in that process was the publication of “unified views”, which present the most commonly used fields in NDT data, and only show tests that meet our current, best understanding of test completeness. This was one step toward Long Term Support of stable schemas for our tables and views in BigQuery. In other words, a lot of work is happening in the background to support long term support for standard BigQuery columns across all M-Lab datasets.
NDT Unified Views Now Published
In November 2019, M-Lab reached a milestone after upgrading the operating system, virtualization, and TCP measurement instrumentation running on our servers worldwide. The upgrade also included a completely re-written ndt-server, providing backward compatibility to old clients, as well as the new ndt7 protocol. With the change in system architecture and the changes to ndt-server, our team wanted to provide unified, longitudinal views of the data in BigQuery that embed the provenance for all tests.
Naming BQ Datasets after M-Lab Measurement Services & Data Types
Earlier this year, M-Lab published blog post outlining our new ETL pipeline and transition to new BigQuery tables. That post also outlined where we’ve saved our datasets, tables, and views in BigQuery historically, and recommended tables and views for most researchers to use. At that time we also implemented semantic versioning to new dataset and table releases at that time, and began publishing BigQuery views that unify our NDT data across multiple schema iterations and migrations.
AFRICOMM 2018 and AFRINIC-29
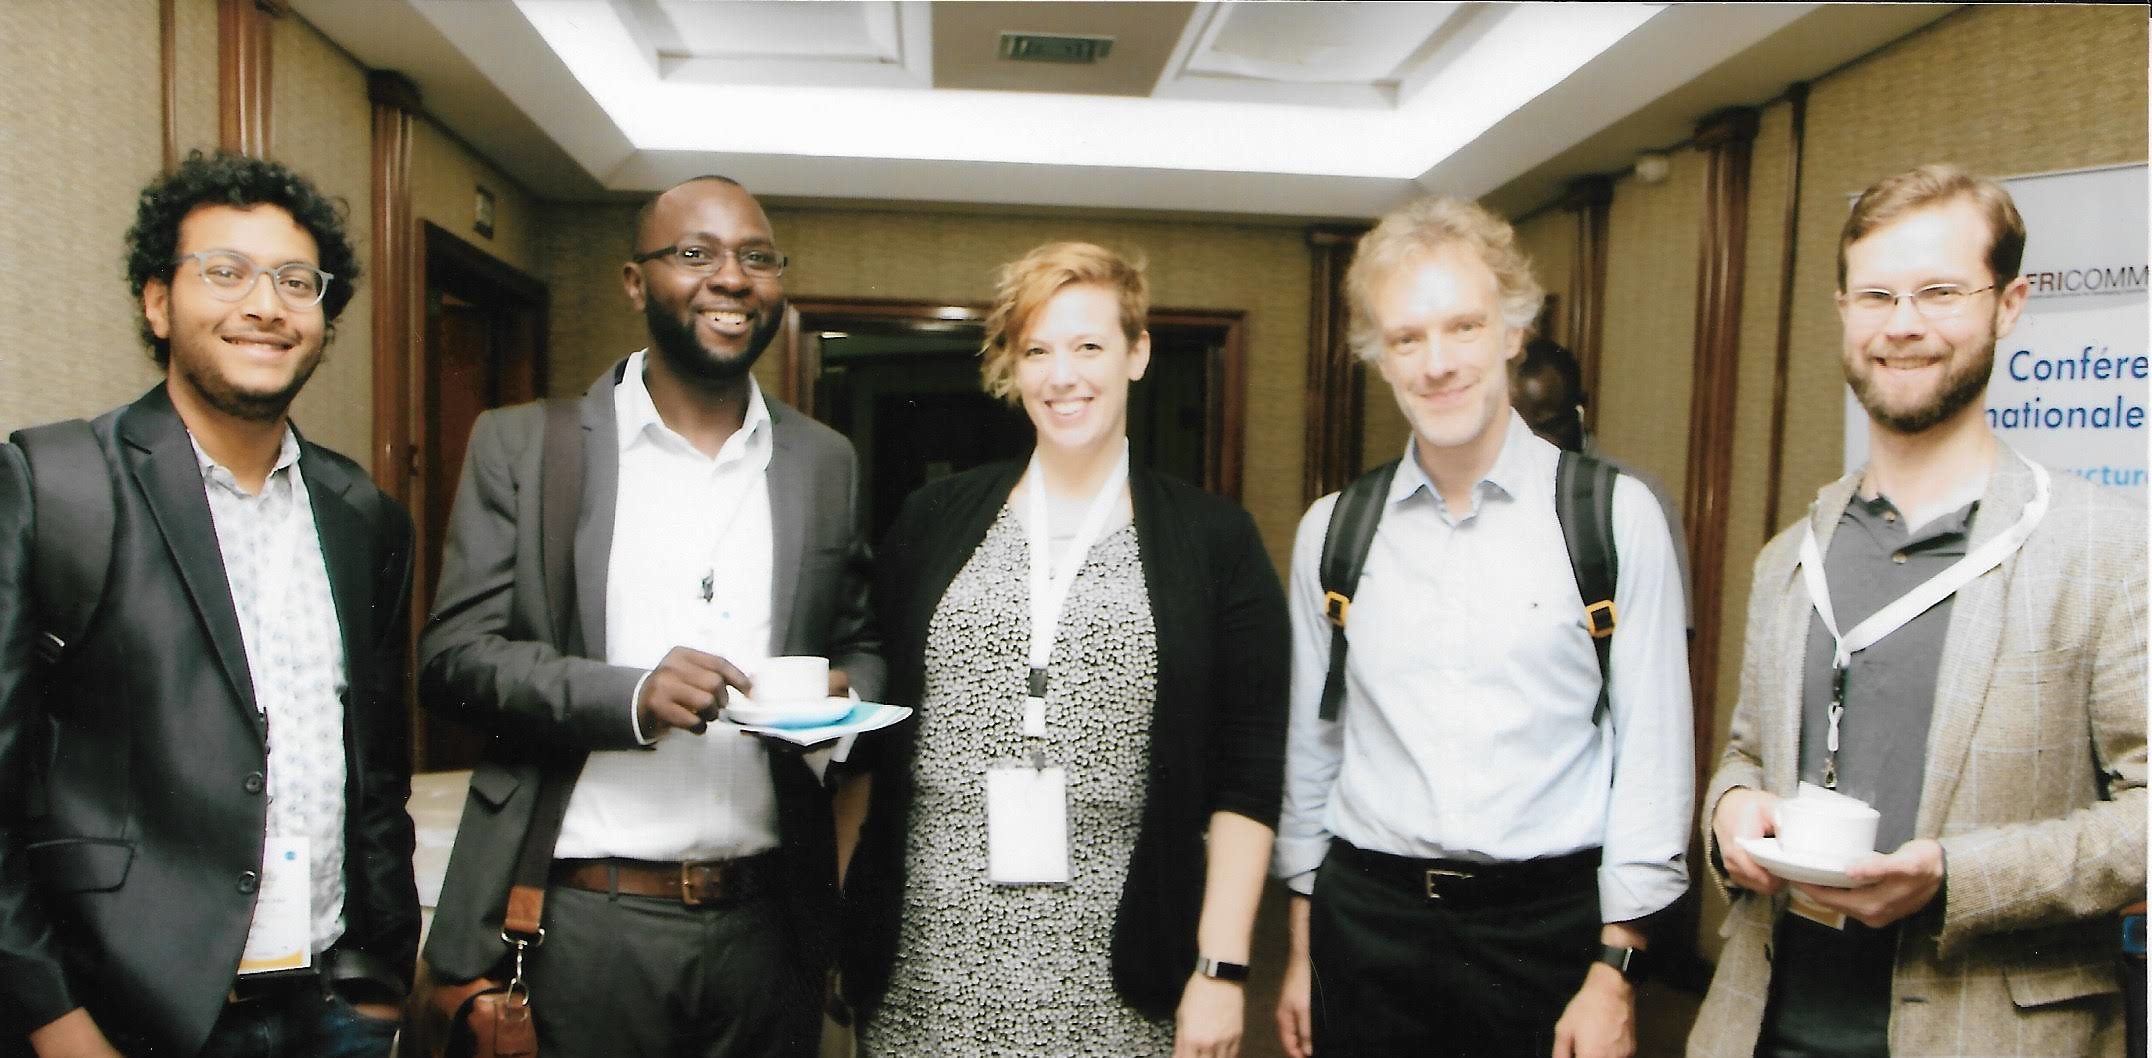
 AFRICOMM 2018. Left to right: Amreesh Phokeer (AFRINIC), Josiah Chavula (University of Capetown), Georgia Bullen (M-Lab), Antoine Delvaux (perfSonar), Stephen Soltesz (M-Lab).
In late November 2018, M-Lab was invited to the Internet Measurement Workshop at AFRINIC-29 in Tunisia and to give a keynote about M-Lab and open internet measurement at AFRICOMM 2018 in Senegal. Both trips were a fantastic opportunity to deepen our relationship with researchers focused on the African Internet, learn more about how our platform is serving community needs, foster conversation around open Internet measurement, and identify opportunities for further collaboration, research and tool development to better support the Internet measurement, research and policy community in Africa.
SIGCOMM 2018 Hackathon Outcomes

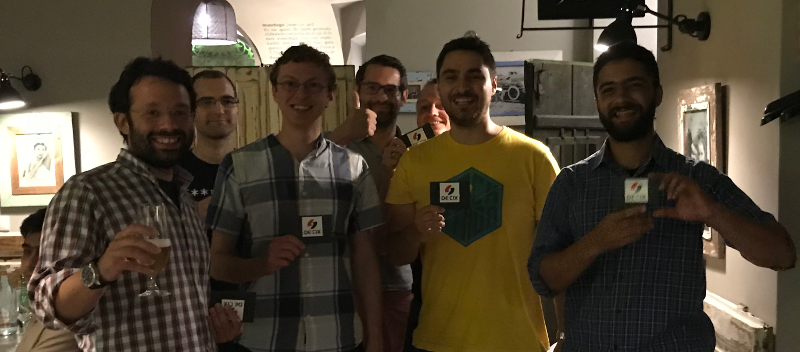
M-Lab had the pleasure of attending the first ever SIGCOMM hackathon on August 25, 2018, at the Nokia Skypark headquarters in Budapest, Hungary. The hackathon, sponsored by Nokia, DECIX, and Netflix, invited network research faculty, students, and industry professionals from around the world to form teams and develop tools, new features or analyses during the Saturday following the SIGCOMM conference.
M-Lab 10 Year Anniversary Event
We’ve reached a point in human history where, for many of us, the Internet has become a standard presence in our daily lives. In the United States, the Internet is simply part of how many of us engage with the world. In other countries (and parts of this one), the Internet remains unaffordable, unreliable, and inaccessible. The Internet unites us in many ways, and at the center of work on the future of the Internet is a dedicated community of experts exploring the questions that will move the Internet to the next level of its evolution: What is an open Internet? What is a healthy Internet? What factors contribute to the Internet ecosystem’s health?
Switch discard investigation for early 2018
On February 1st, 2018, during a regular data quality review, we identified an increase in switch discards at sites with 10Gbps equipment connected to 1Gbps uplinks. We used our switch telemetry data to assess whether there were any negative consequences for tests contained in our SideStream or NDT data sets, and then we used the same data sets to determine whether our remediation strategy had any negative effects. In both cases, we found no observable effects, indicating that everything was below the noise floor for Internet performance data.
SIGCOMM 2018 Hackathon
- When: Saturday, August 25, 2018
- Where: SIGCOMM, Budapest, Hungary
M-Lab will be at this year’s SIGCOMM hackathon in Budapest, Hungary. Check out the projects we’re hoping to work on with folks on the hackathon wiki.
M-Lab is Turning 10!

- When: Aug. 7, 2018 - Aug. 8, 2018, 9AM - 5PM
- Where: New America, 740 15th St NW #900, Washington, D.C. 20005
Measurement Lab is turning 10! On August 7 and 8, we look forward to gathering the Measurement Lab community to showcase how the platform has evolved, learn from you about how you are using M-Lab, and discuss how we plan for the next 10 years of measuring the Internet and providing public data to the world. So much has changed over the last 10 years (and that’s not just our expanding volume of longitudinal data!), come celebrate, brainstorm, analyze, and share with us.
New DISCO switch telemetry dataset
Since June 2016, M-Lab has collected high resolution switch telemetry for each M-Lab server and site uplink.
Originally designed to detect switch discards from server traffic microbursts, we now support the DIScard COllection (a.k.a. DISCO) dataset as a standard M-Lab BigQuery table: measurement-lab.base_tables.switch
New ETL Pipeline and Transition to New BigQuery Tables
Since May 2017, the M-Lab team has been working on an updated, open source pipeline, which pulls raw data from our servers, saves it to Google Cloud Storage, and then parses it into our BigQuery tables. The team is particularly excited about this update because it means that the pipeline no longer relies on closed source libraries.
Transitioning to a New Backend Pipeline and Data Availability
M-Lab data is collected from distributed experiments hosted on servers all over the world, processed in a pipeline, and published for free in both raw and parsed (structured) formats. The back end processing component for this has served us well for many years, but it’s been showing its age recently. As M-Lab collects an increasing amount of data thanks to new partnerships, we have been concerned that it will not be as reliable.
Making it Easier to Use M-Lab Data
In January, M-Lab launched a beta test of new BigQuery tables for M-Lab data. Today, M-Lab is pleased to announce that the beta test was successful. The new, faster-performing tables will be M-Lab’s new standard BigQuery tables.
Before we move on to specifics, when we say faster performing, we mean a lot faster. As in, certain queries that used to take over 2 hours now complete in 8 seconds. That means that playing with the data just became a lot more fun.
To help users dig in to this data as quickly and seamlessly as possible, M-Lab has consolidated all of its data documentation and updated it to show how to take advantage of the new tables.
Announcing improved performance for M-Lab BigQuery data
Today, M-Lab is happy to announce the public beta of new M-Lab BigQuery tables. These tables provide substantially improved performance and reduce the difficulty of writing BigQuery SQL.