Changes Related to COVID-19
As COVID-19’s impact increases globally, more people are working, learning and living online. Internet infrastructure is critical in these moments. The user-initiated measurements collected by M-Lab provide an opportunity to understand whether our shared infrastructure can handle the unprecedented shift of load to the network’s edges. The following is a snapshot analysis of how our platform’s traffic has shifted in the last three weeks. We will follow up with DataStudio dashboards using our public data set soon.
As these dashboards will show, the benefit of open data is that anyone can access it, use it, and reproduce research done with it. If you are using or would like to use M-Lab data in your response to the Internet’s performance during COVID-19, please let us know!
Key Takeaways
- Test volume is increasing
- Some areas/networks appear to be saturated during peak times
Time Periods
For this analysis, we have selected two time periods:
- Recent:
- 2020-03-05 to 2020-03-26
- 3 Weeks Earlier:
- 2020-02-13 to 2020-03-05
Increasing Global Test Rates
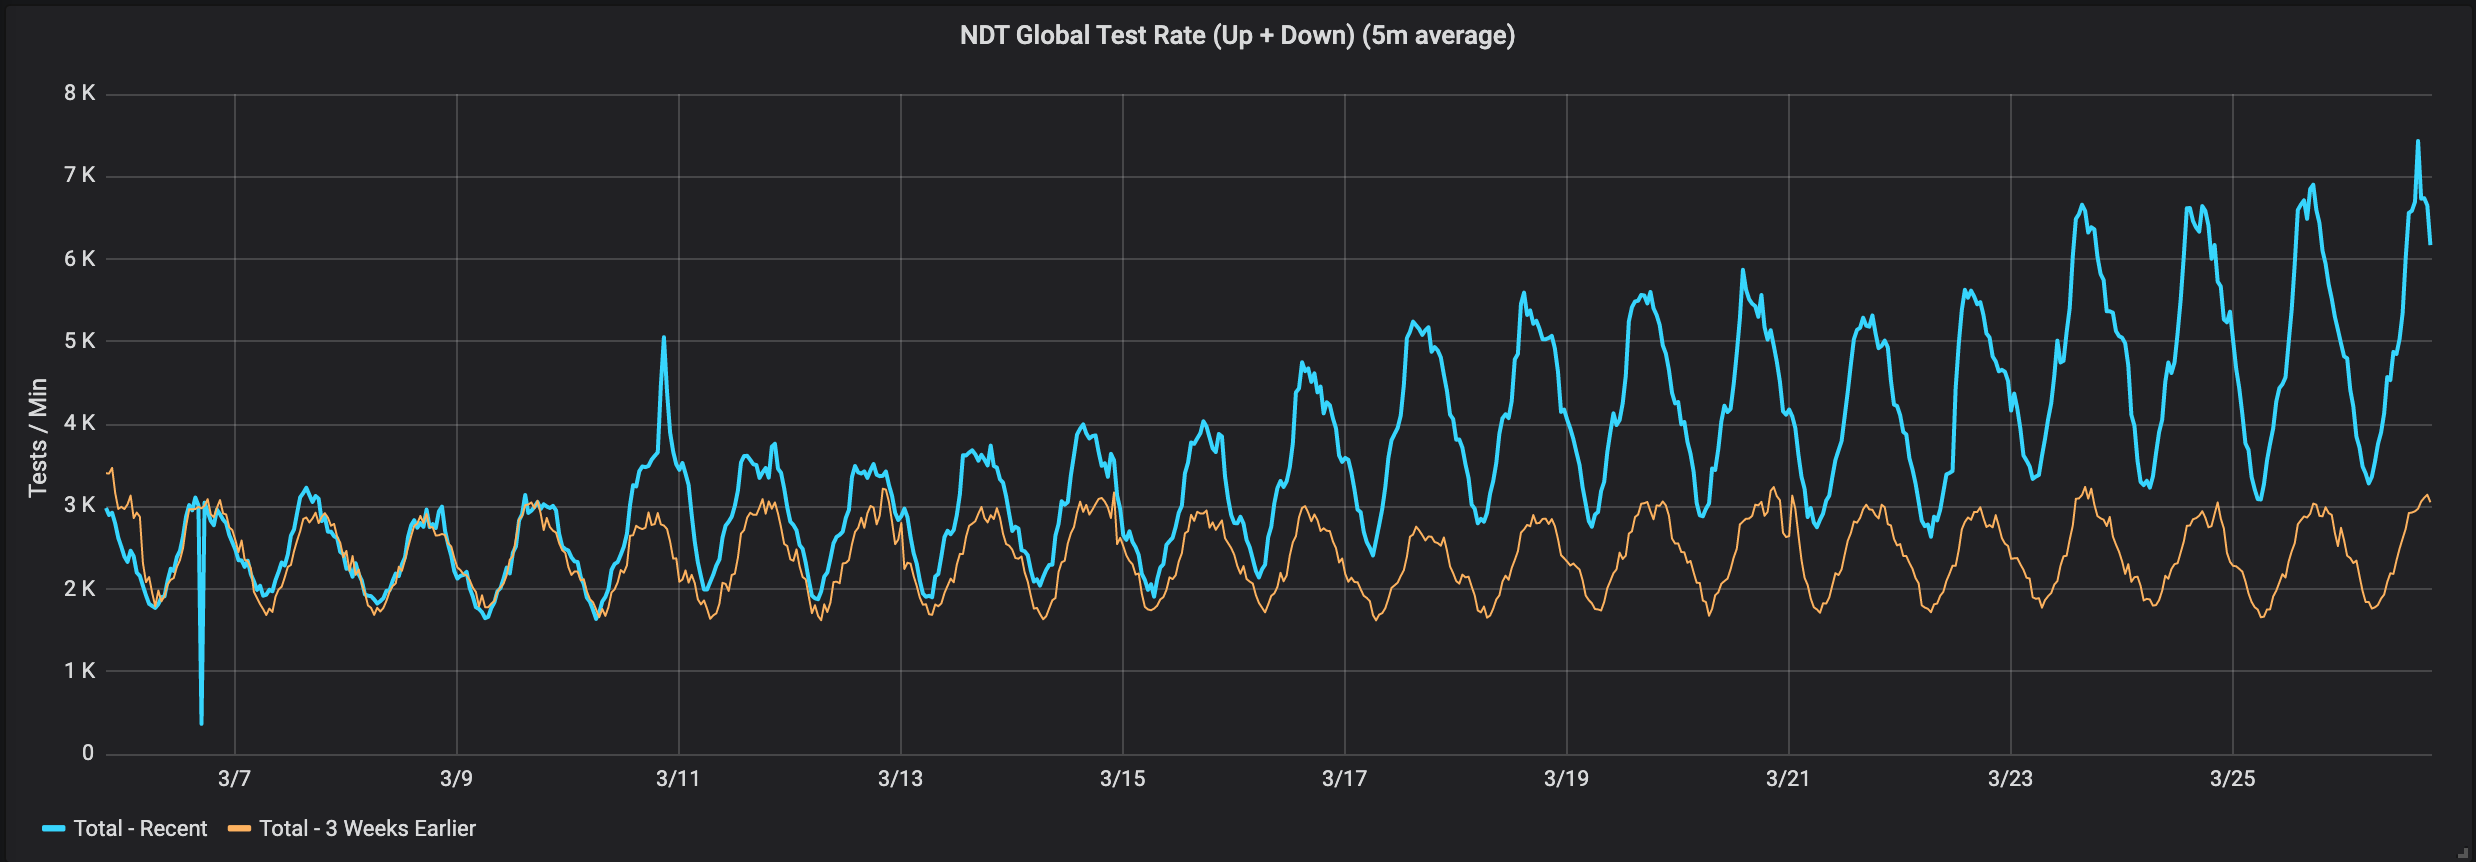 NDT Global Test Rate (tests/min): The blue line is the most recent 3 weeks. The orange line is 3 weeks earlier than the same point on the blue line. Starting around March 10th, the NDT global test rate has increased from steadily around 3000 tests/min to over 7000 tests/min.
Greater Increase for Regional Test Rates
The NDT measurement service currently supports three protocols: WSS (Secure WebSockets), WS (WebSockets), and PLAIN (TCP). Different protocols are used by different clients. The analysis below only uses download tests, and focuses on WSS and PLAIN test protocols.
Area Surrounding New York, USA
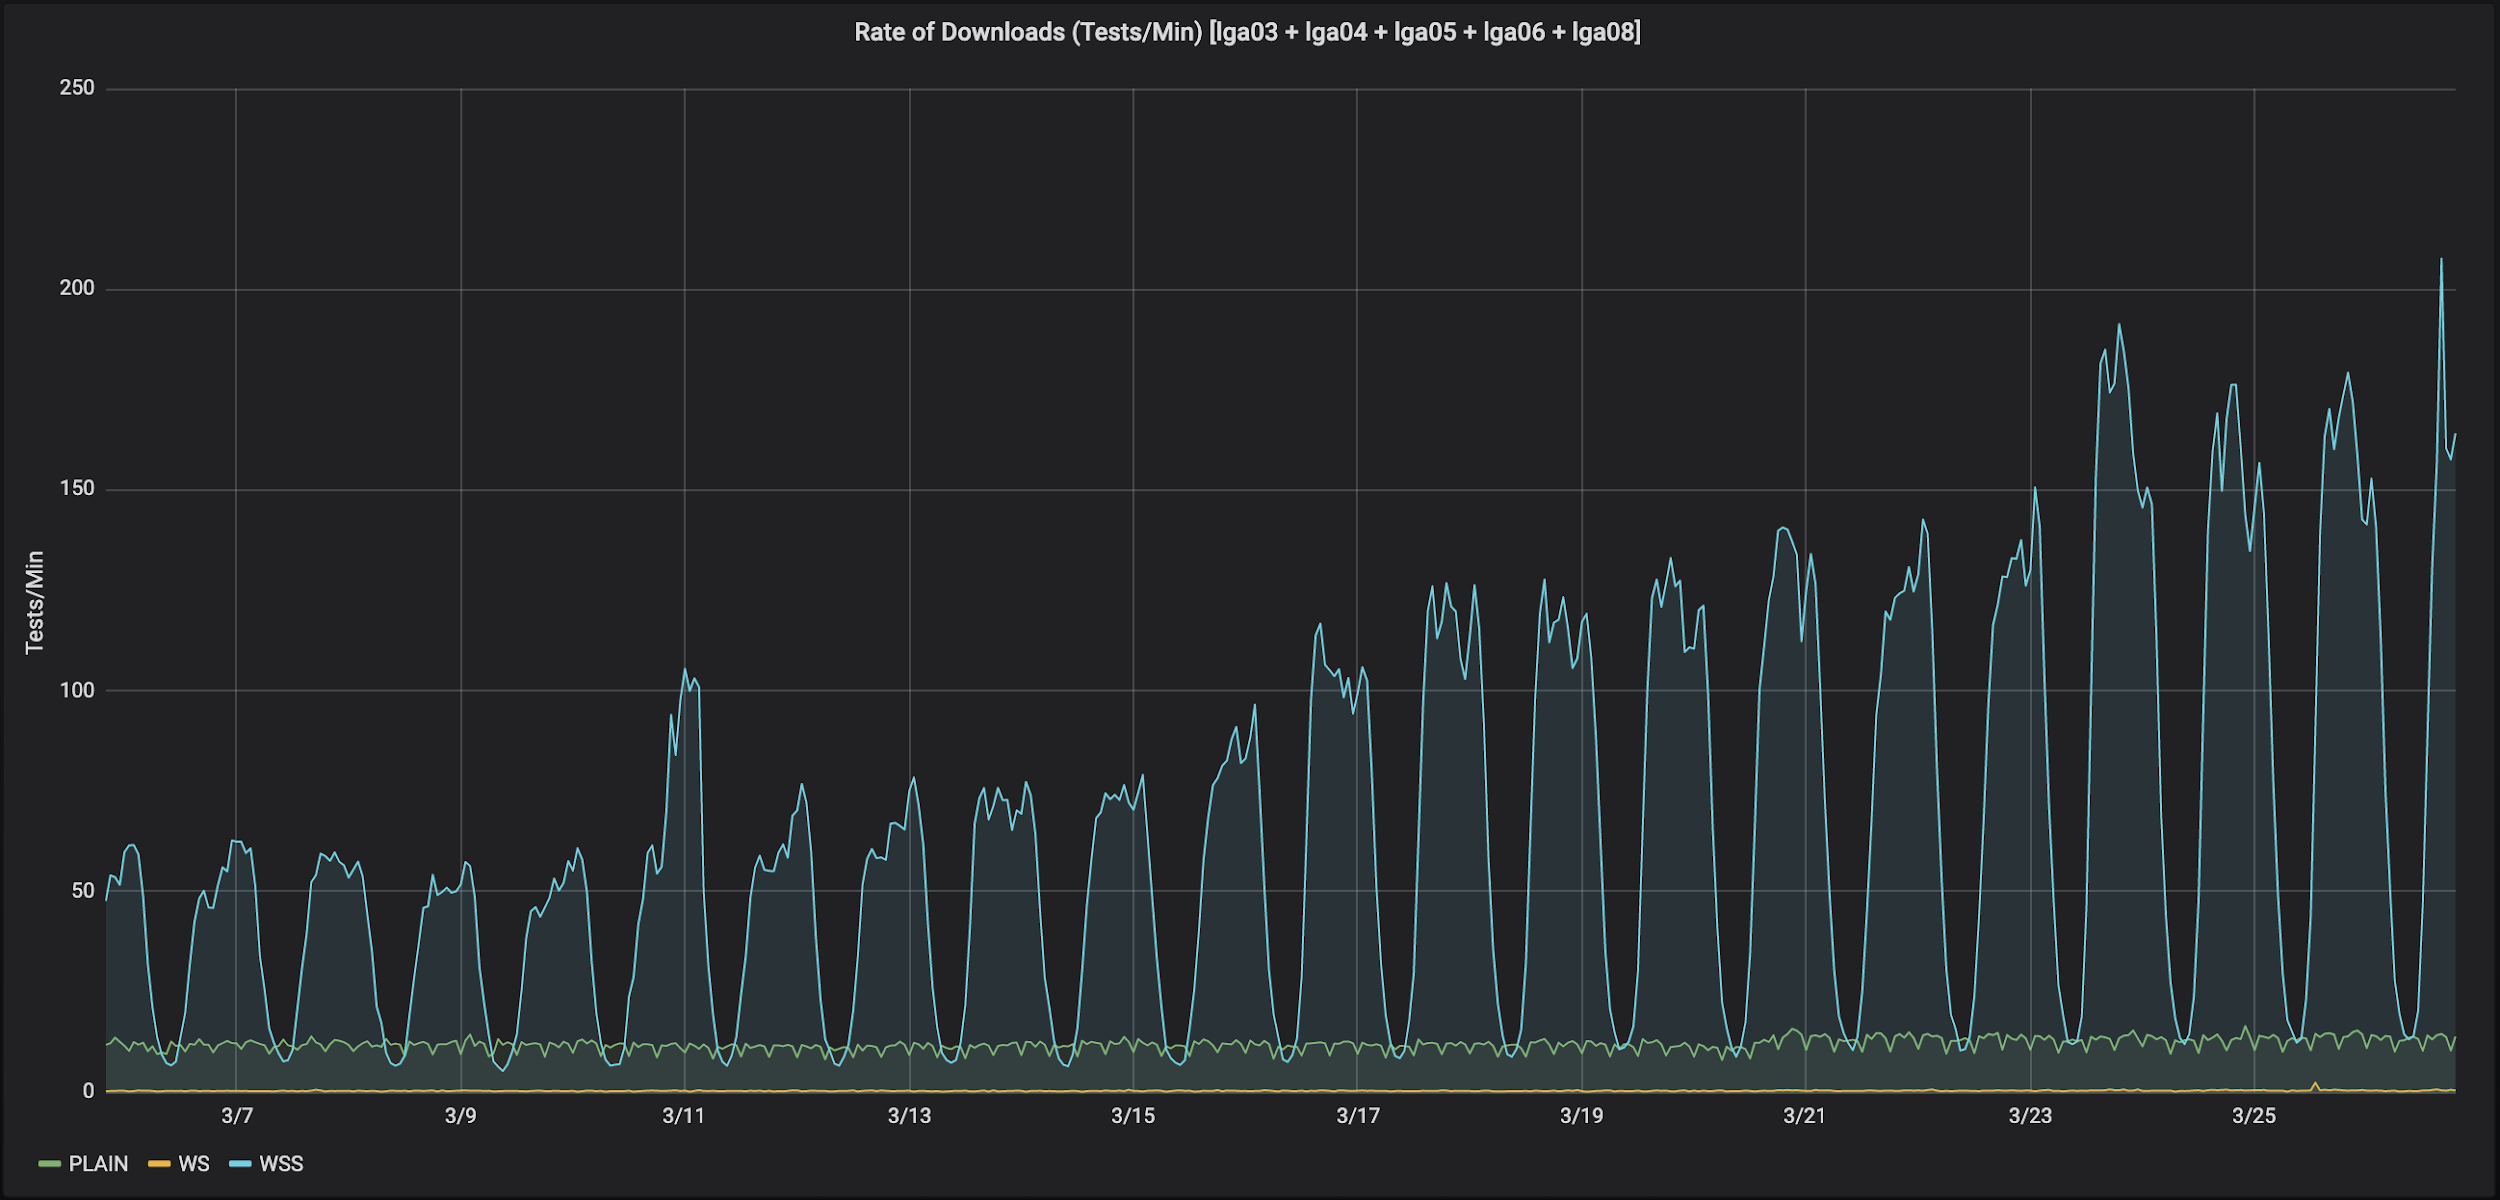 Rate of Downloads in Area Surrounding New York, USA (tests/min): Looking only at download tests, the PLAIN tests do not see the daily variation that we see in the WSS tests. Nor do the PLAIN test rates increase as much as the rate of WSS tests. These servers see test rates over three times a few weeks earlier. People are running more speed tests.
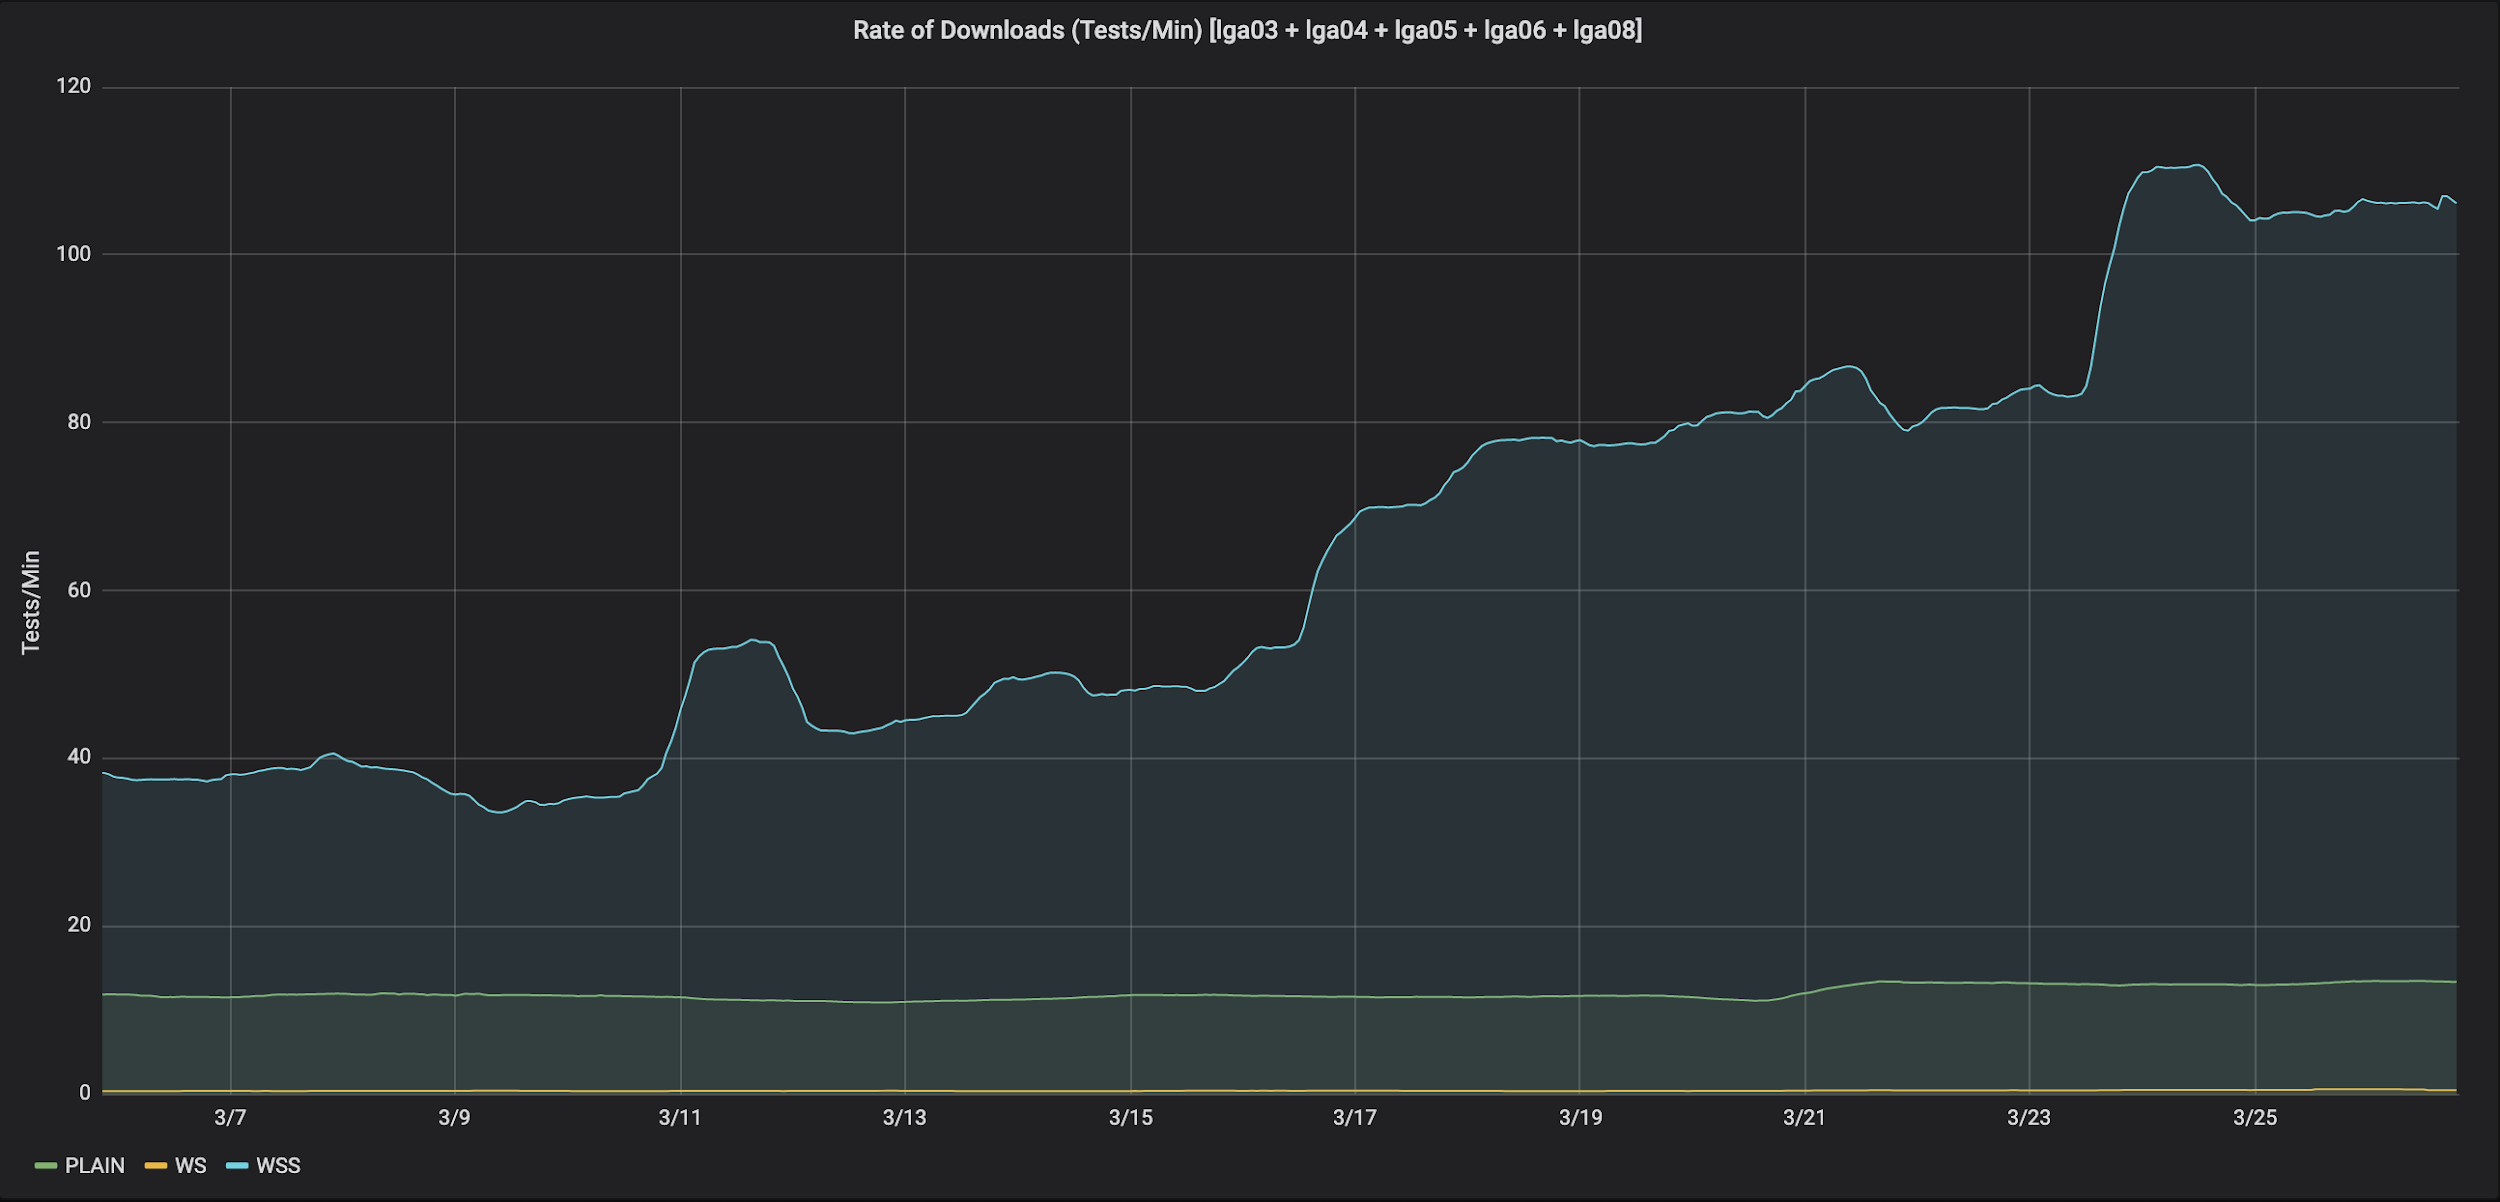 In the US, PLAIN tests are typically run by automation and WSS tests are run interactively by people.
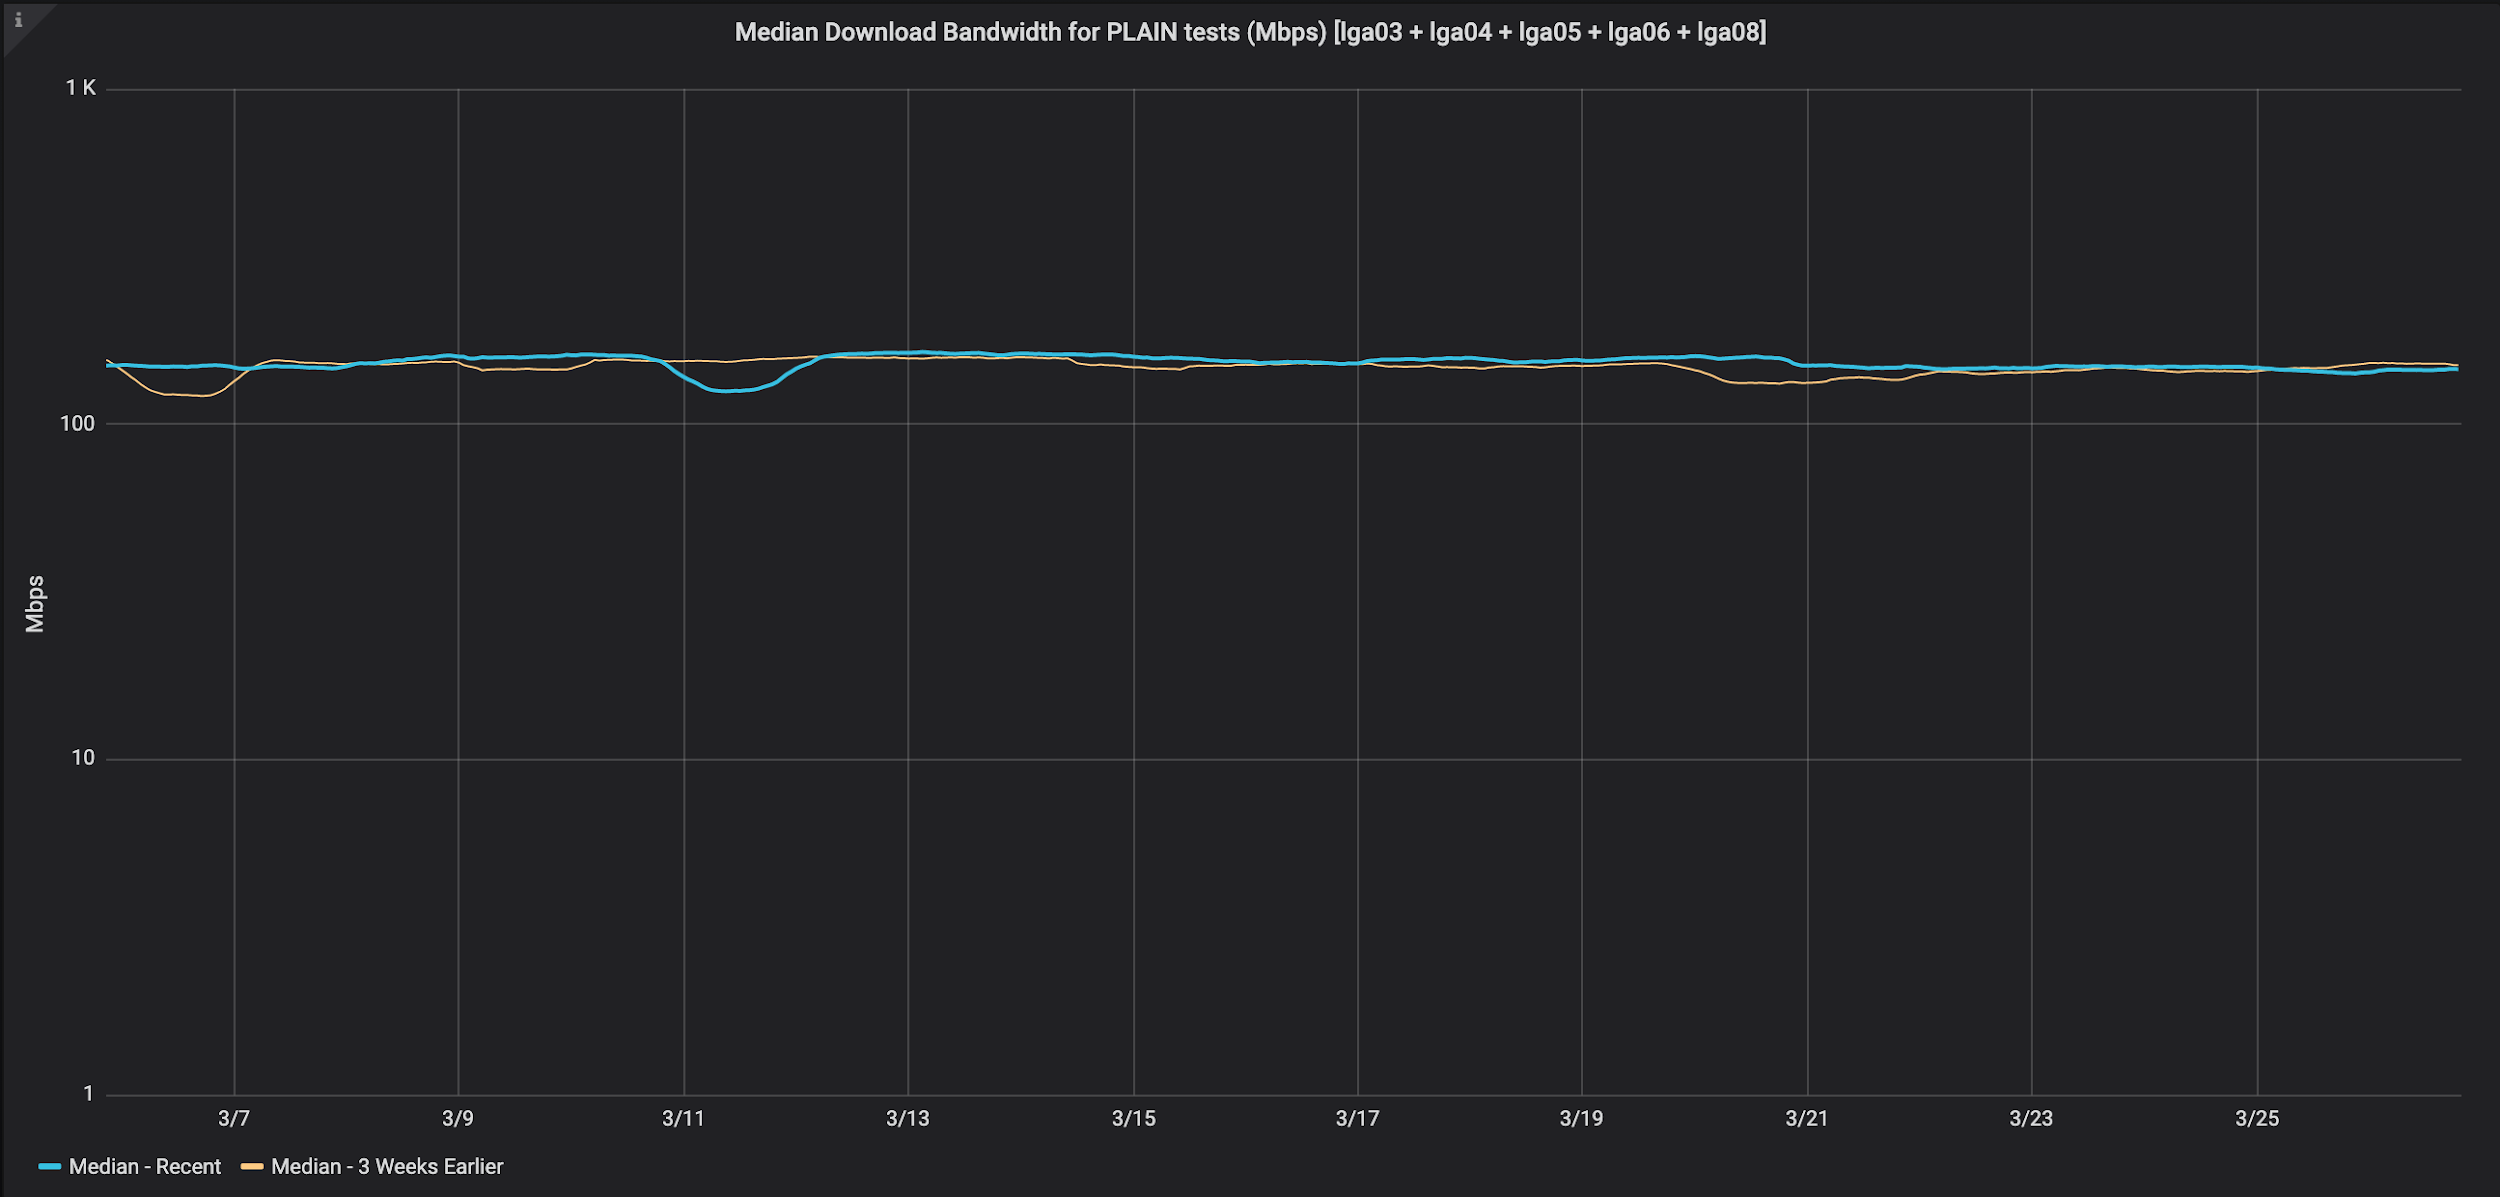
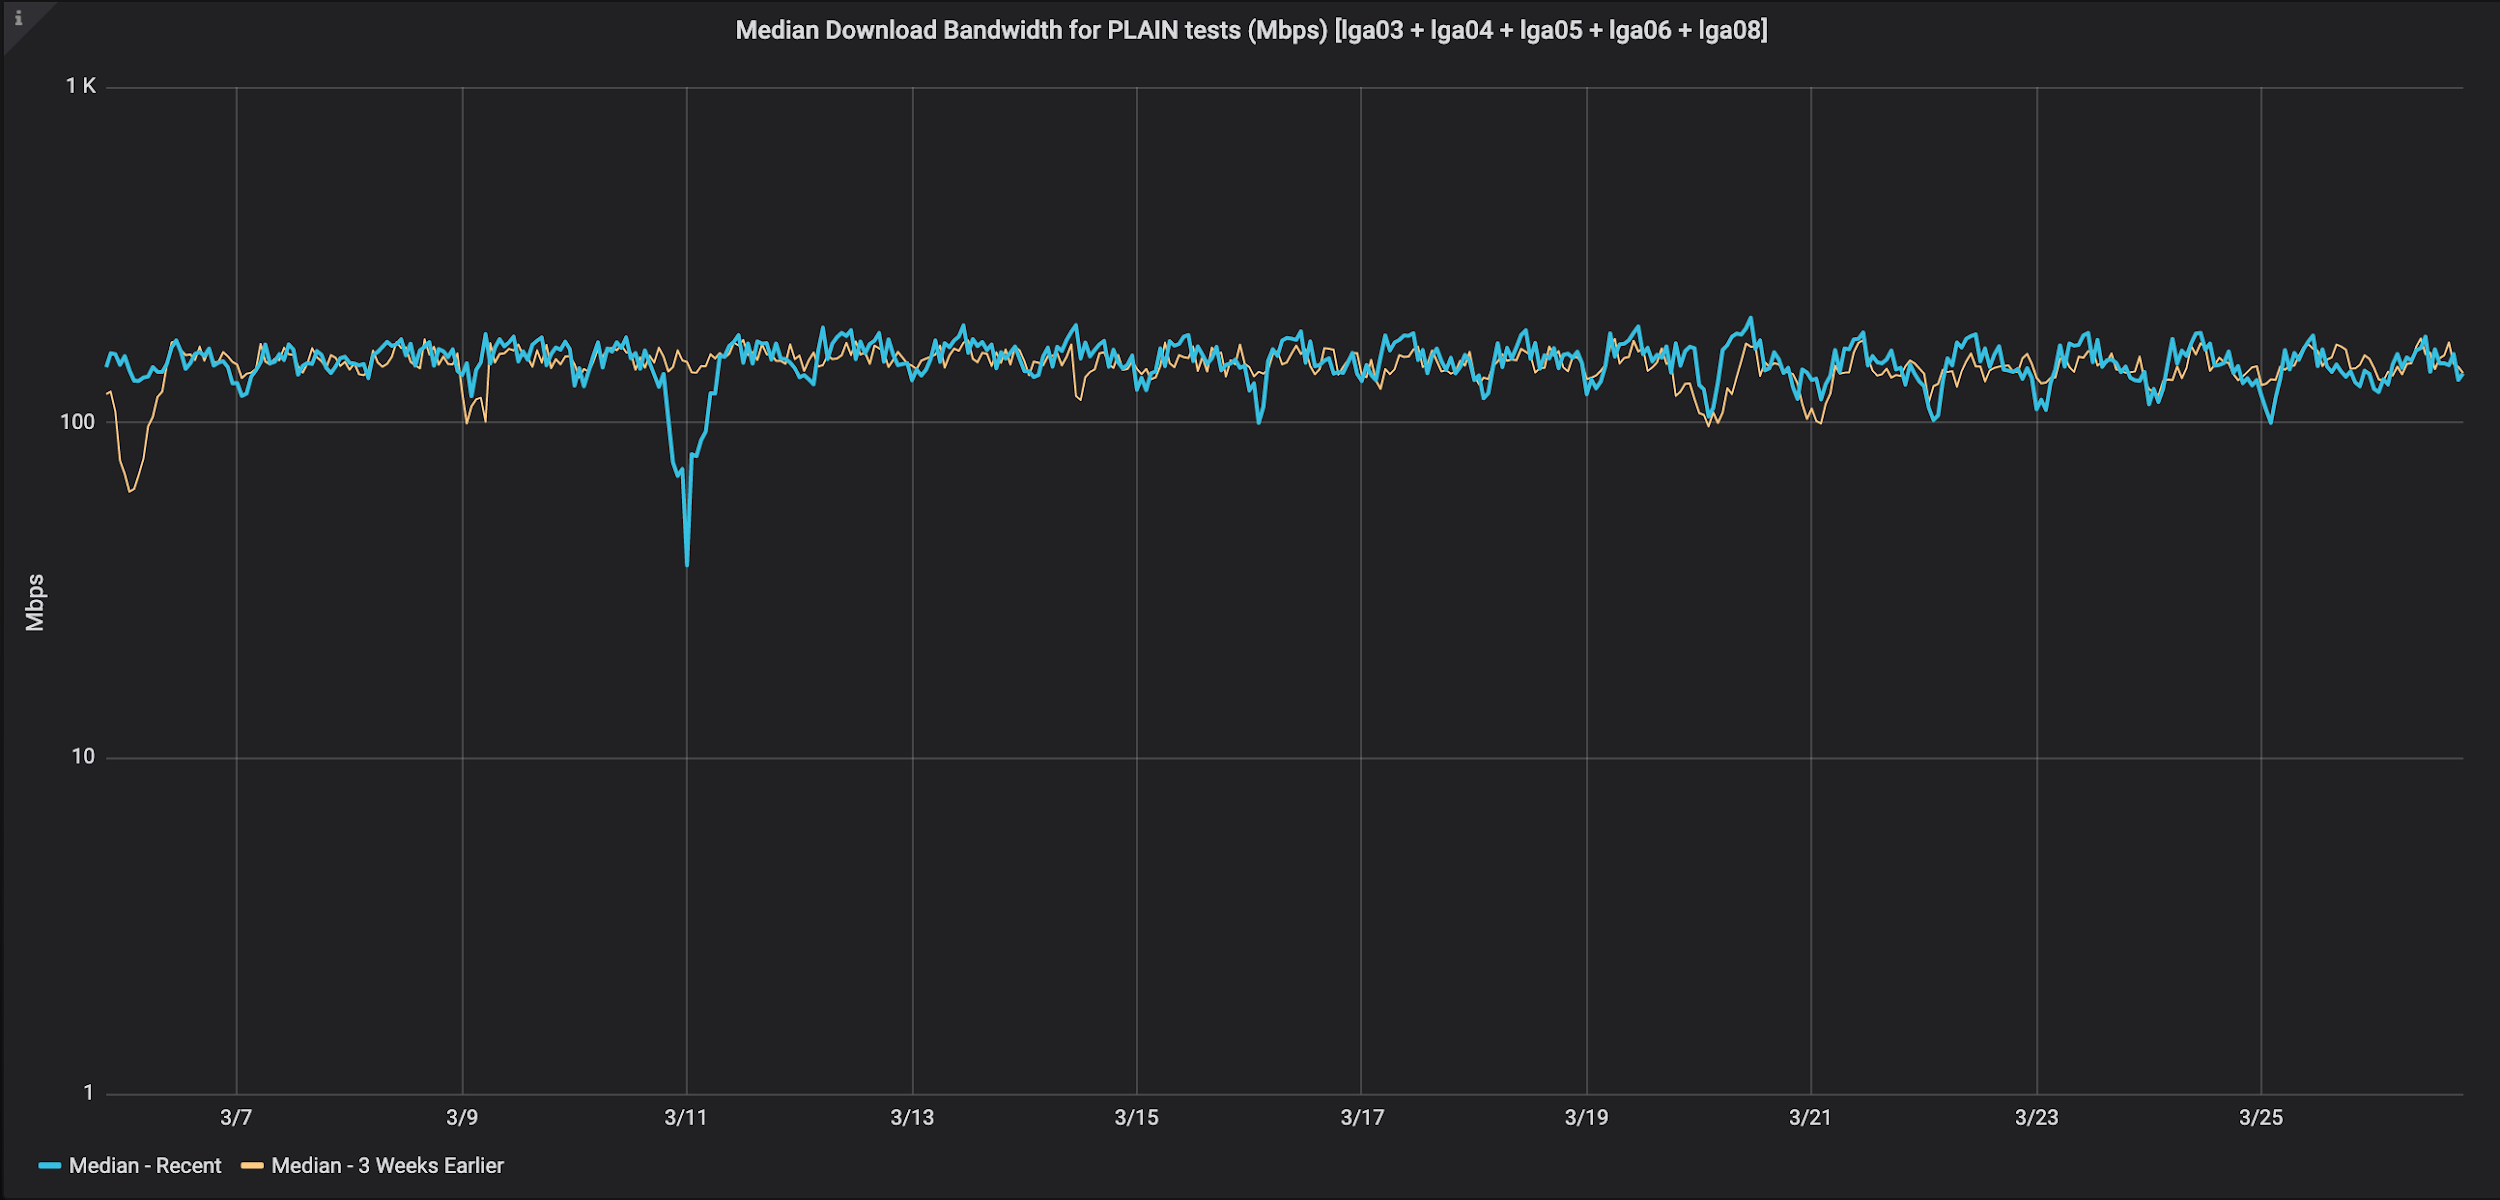 Median Download Bandwidth for PLAIN tests (Mbps): This graph compares the median download rate for recent PLAIN tests to 3 weeks earlier. Because the volume of PLAIN tests did not increase, we believe the client population remained the same. With the exception of one event on March 11th, there is no apparent change in median performance for these clients. These clients average around 160Mbps.
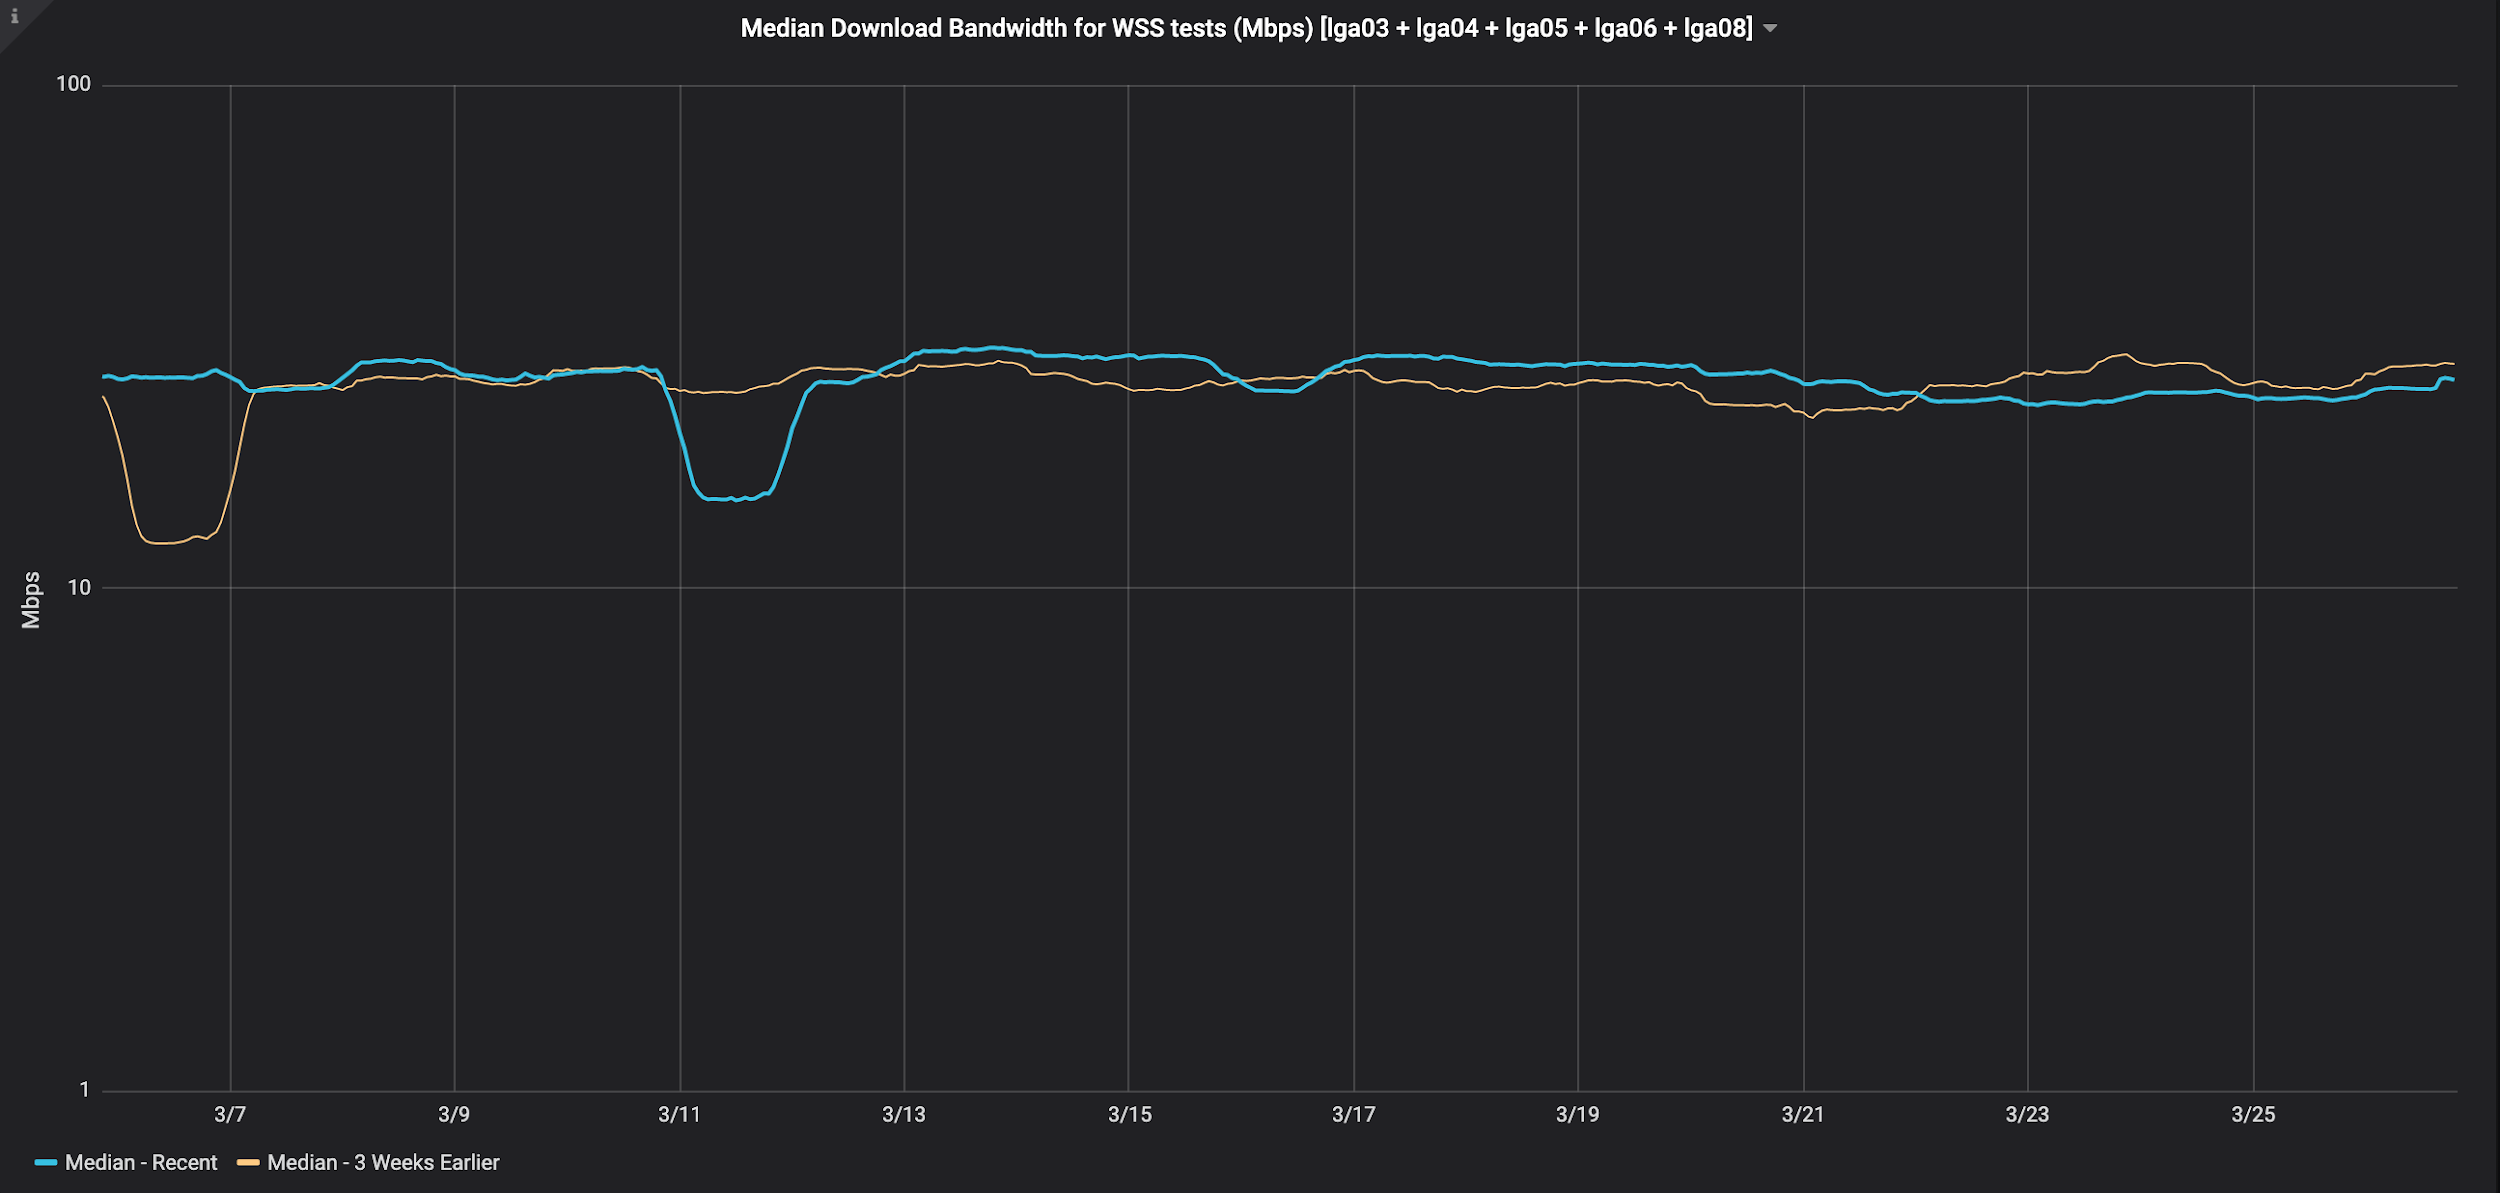
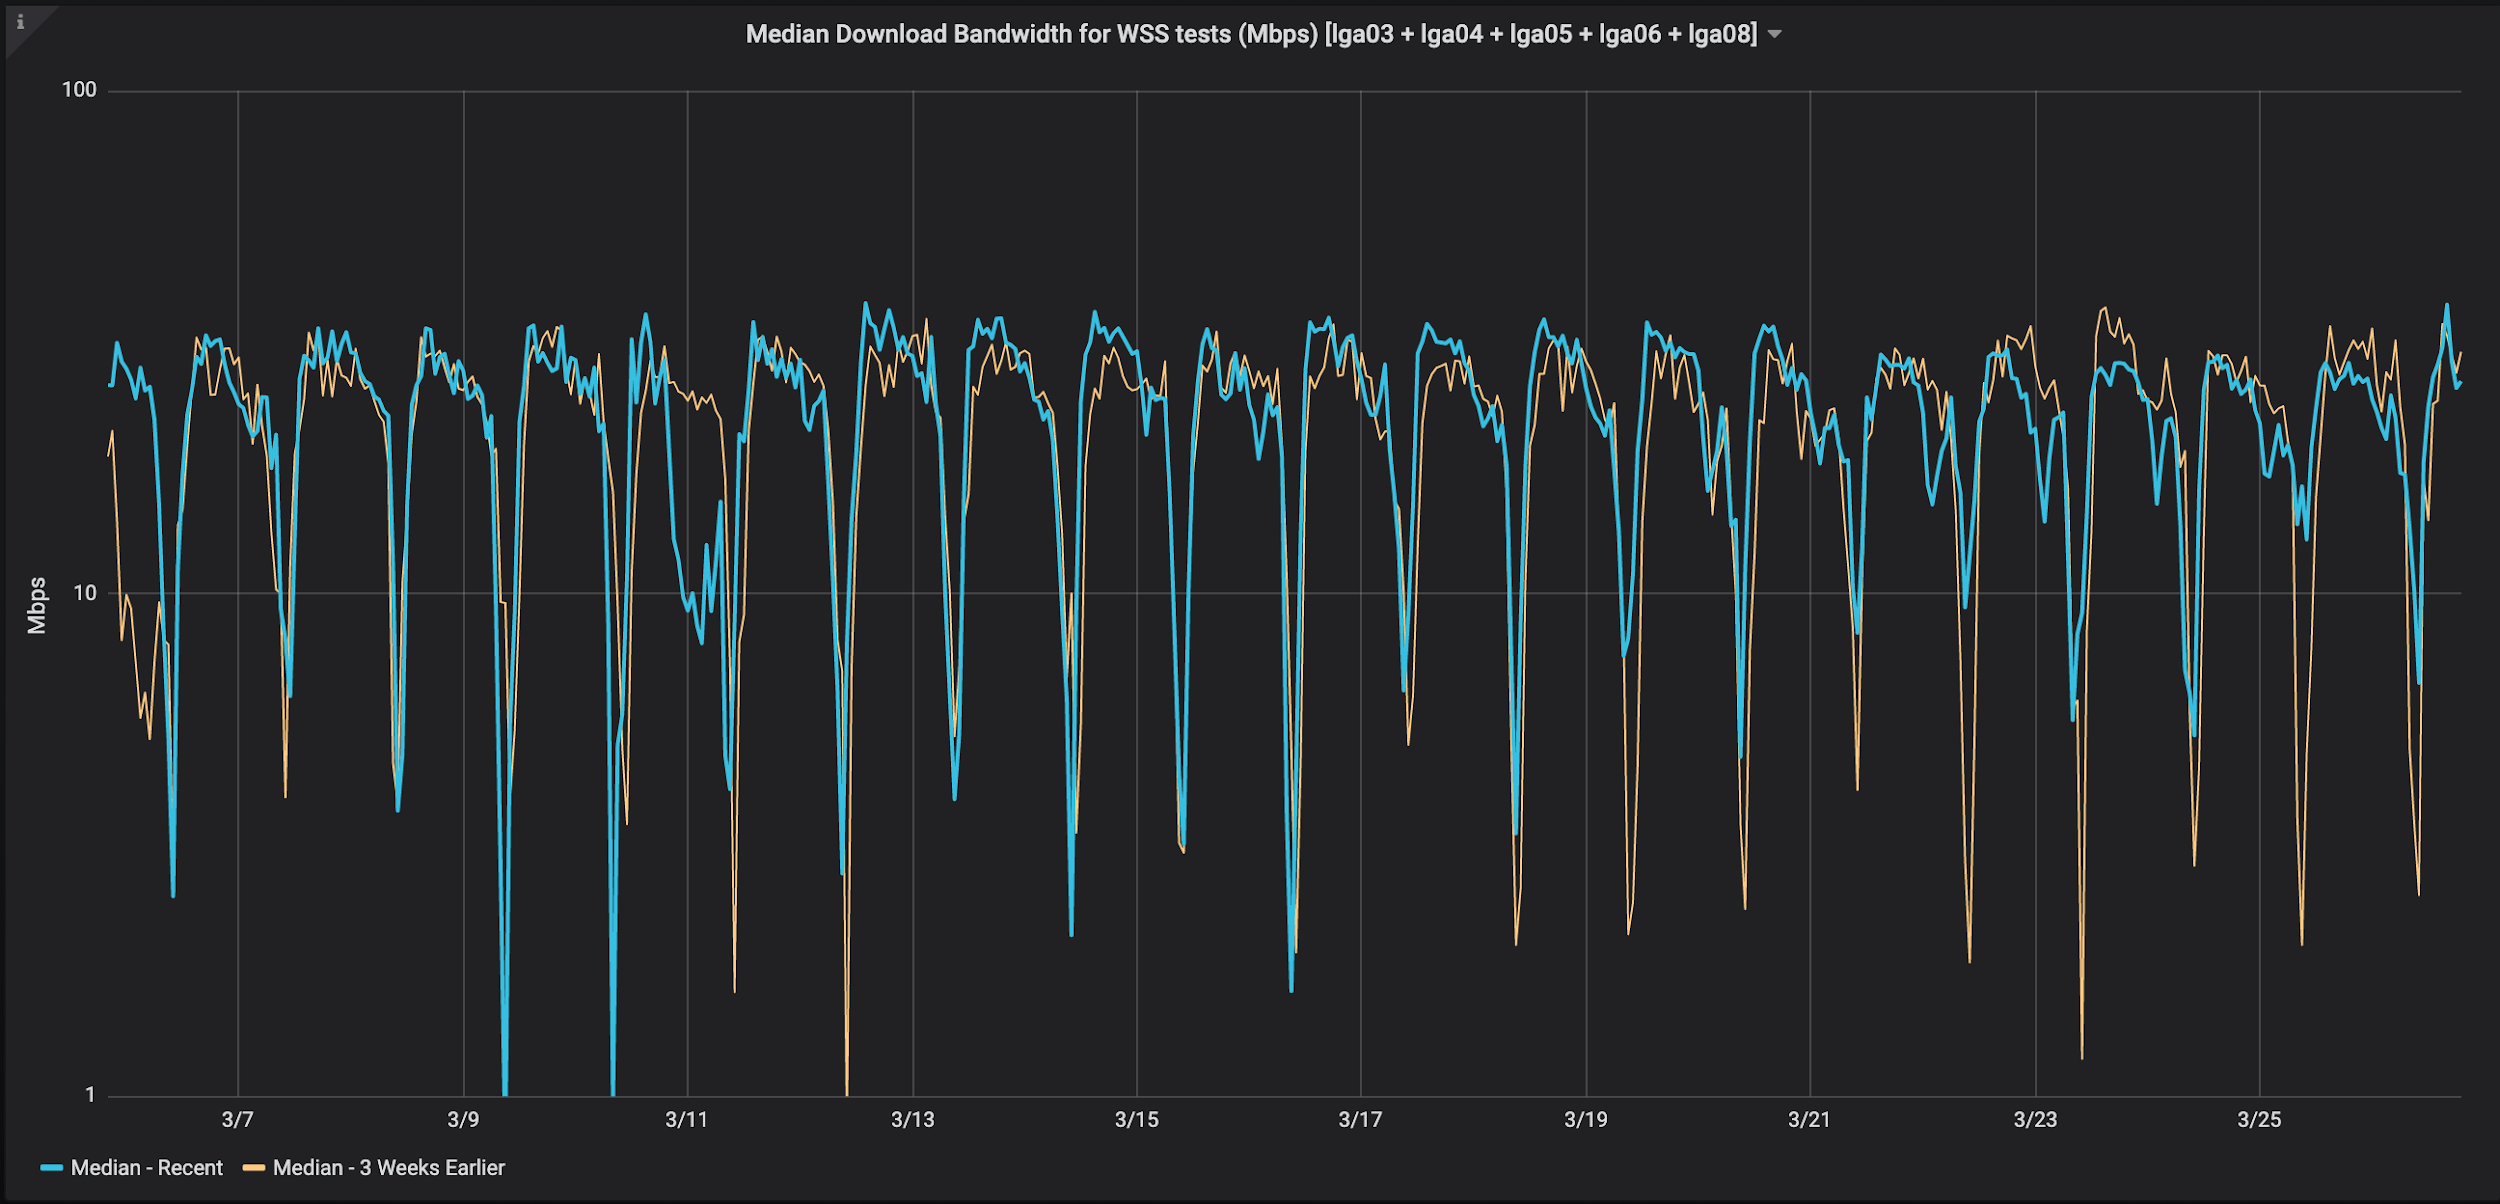 Median Download Bandwidth for WSS tests (Mbps): This graph compares the median download rate for recent WSS tests to 3 weeks earlier. The nightly drop in median performance is a result of people running fewer tests and our operational monitoring using WSS at slow rates and driving down the median.
Typical median performance is around 30Mbps.
Here we see a more dramatic change in behavior on March 11th. And, in recent days from the 23rd, 24th, and 25th, the median download rate for these clients has reduced between 5 to 10Mbps compared to 3 weeks earlier.
Area Surrounding São Paulo, Brazil
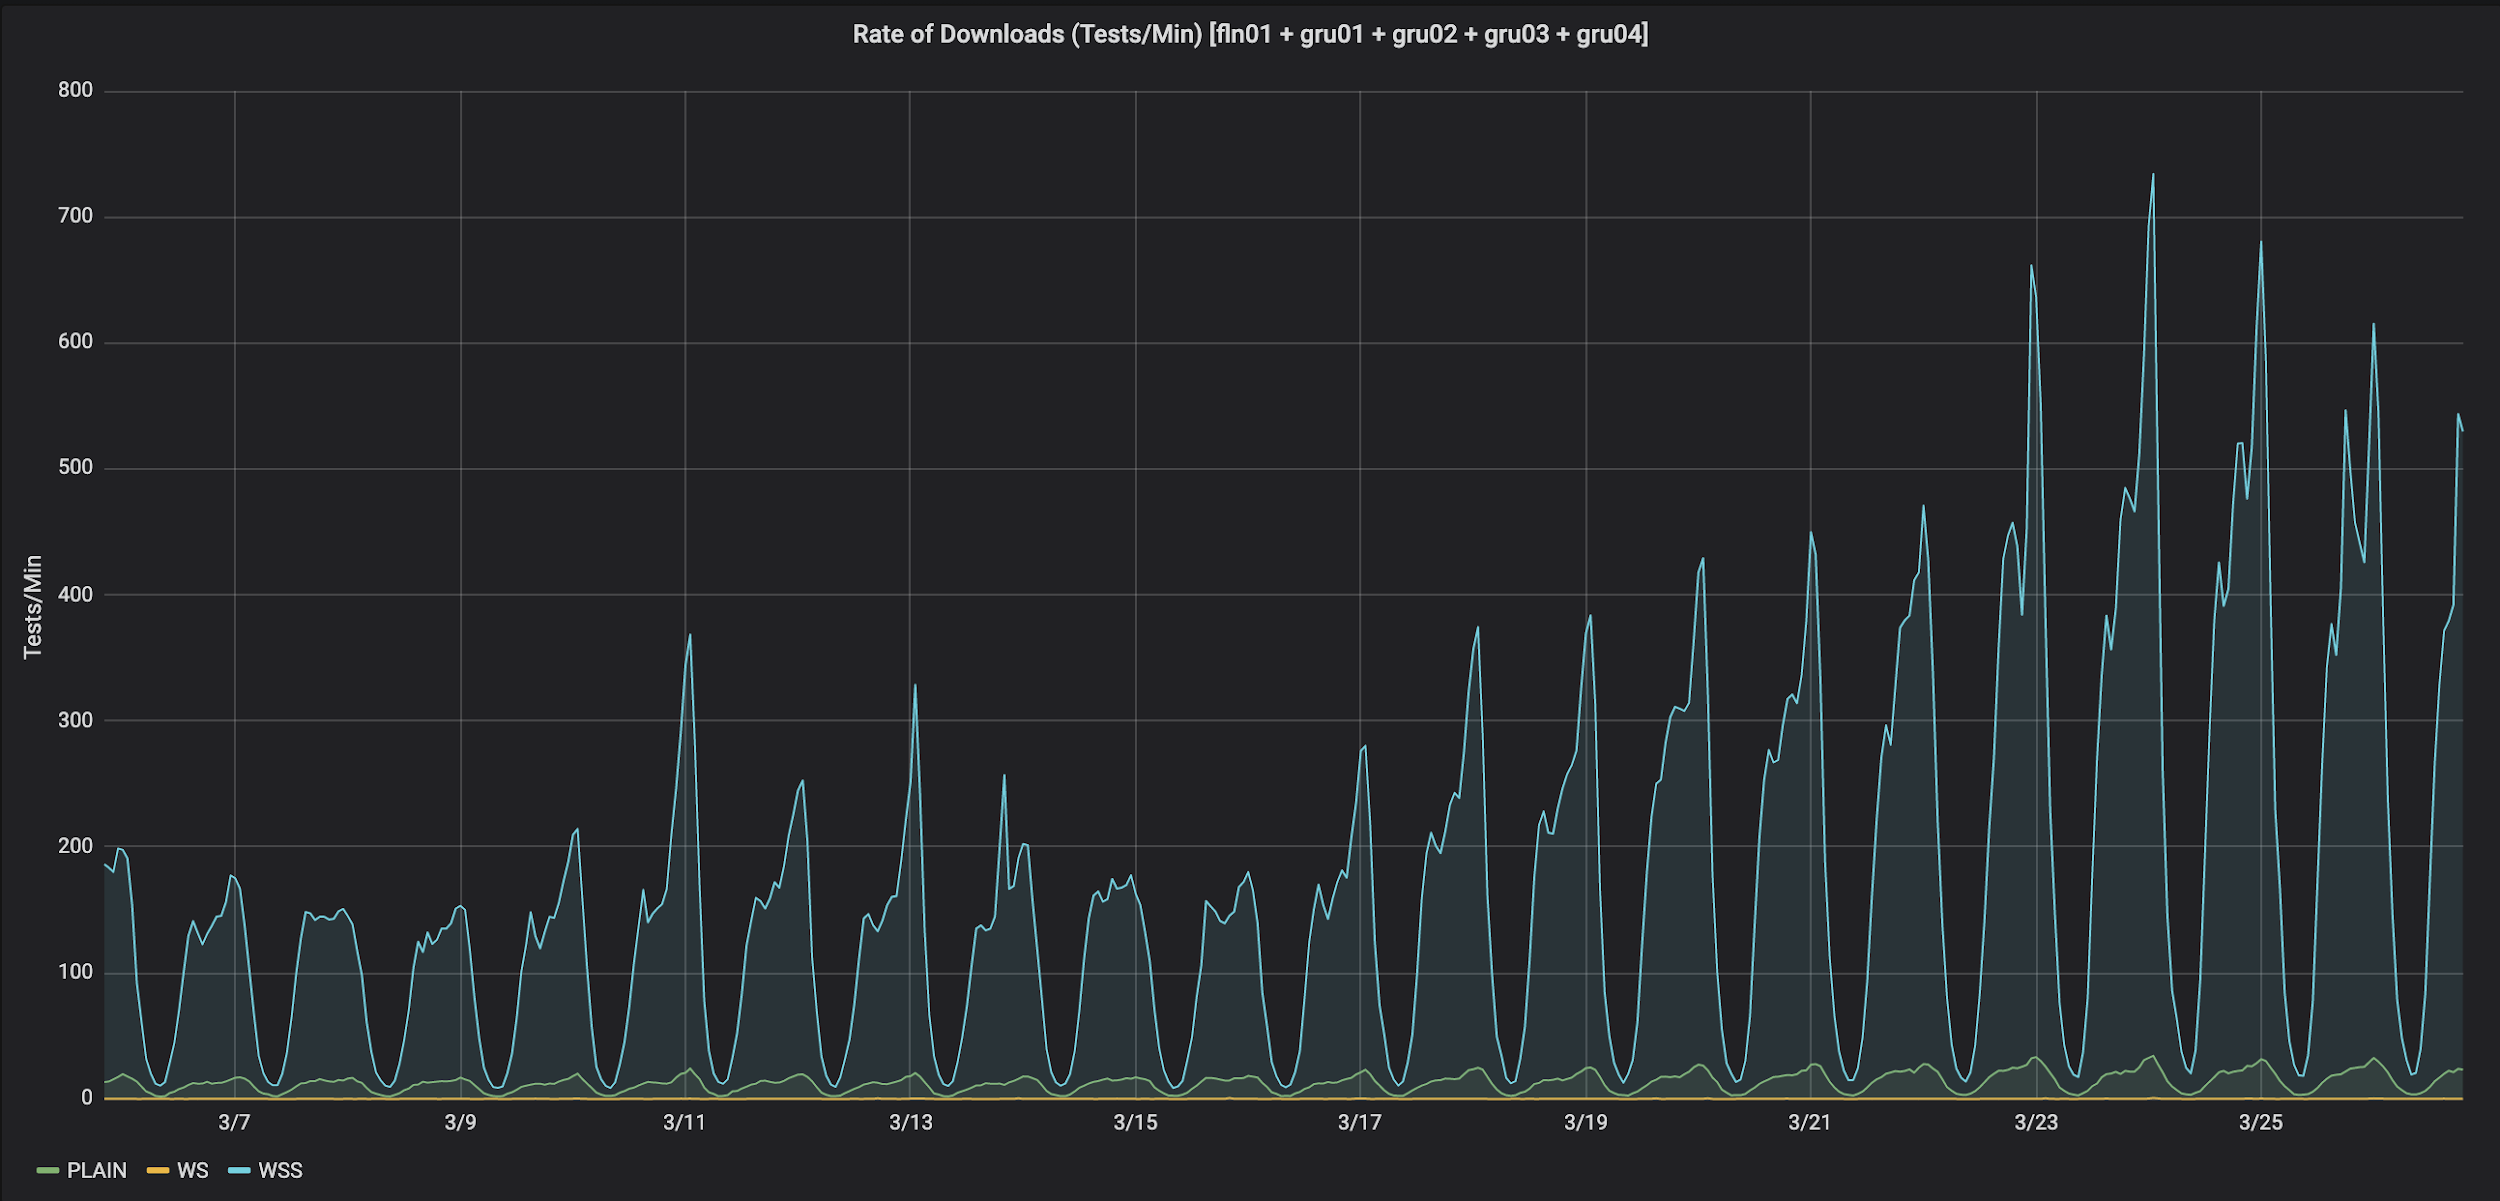 Rate of Downloads in Area Surrounding São Paulo, Brazil (tests/min): Looking only at download tests, the PLAIN tests do see daily variation just like the WSS tests. People are running more speed tests.
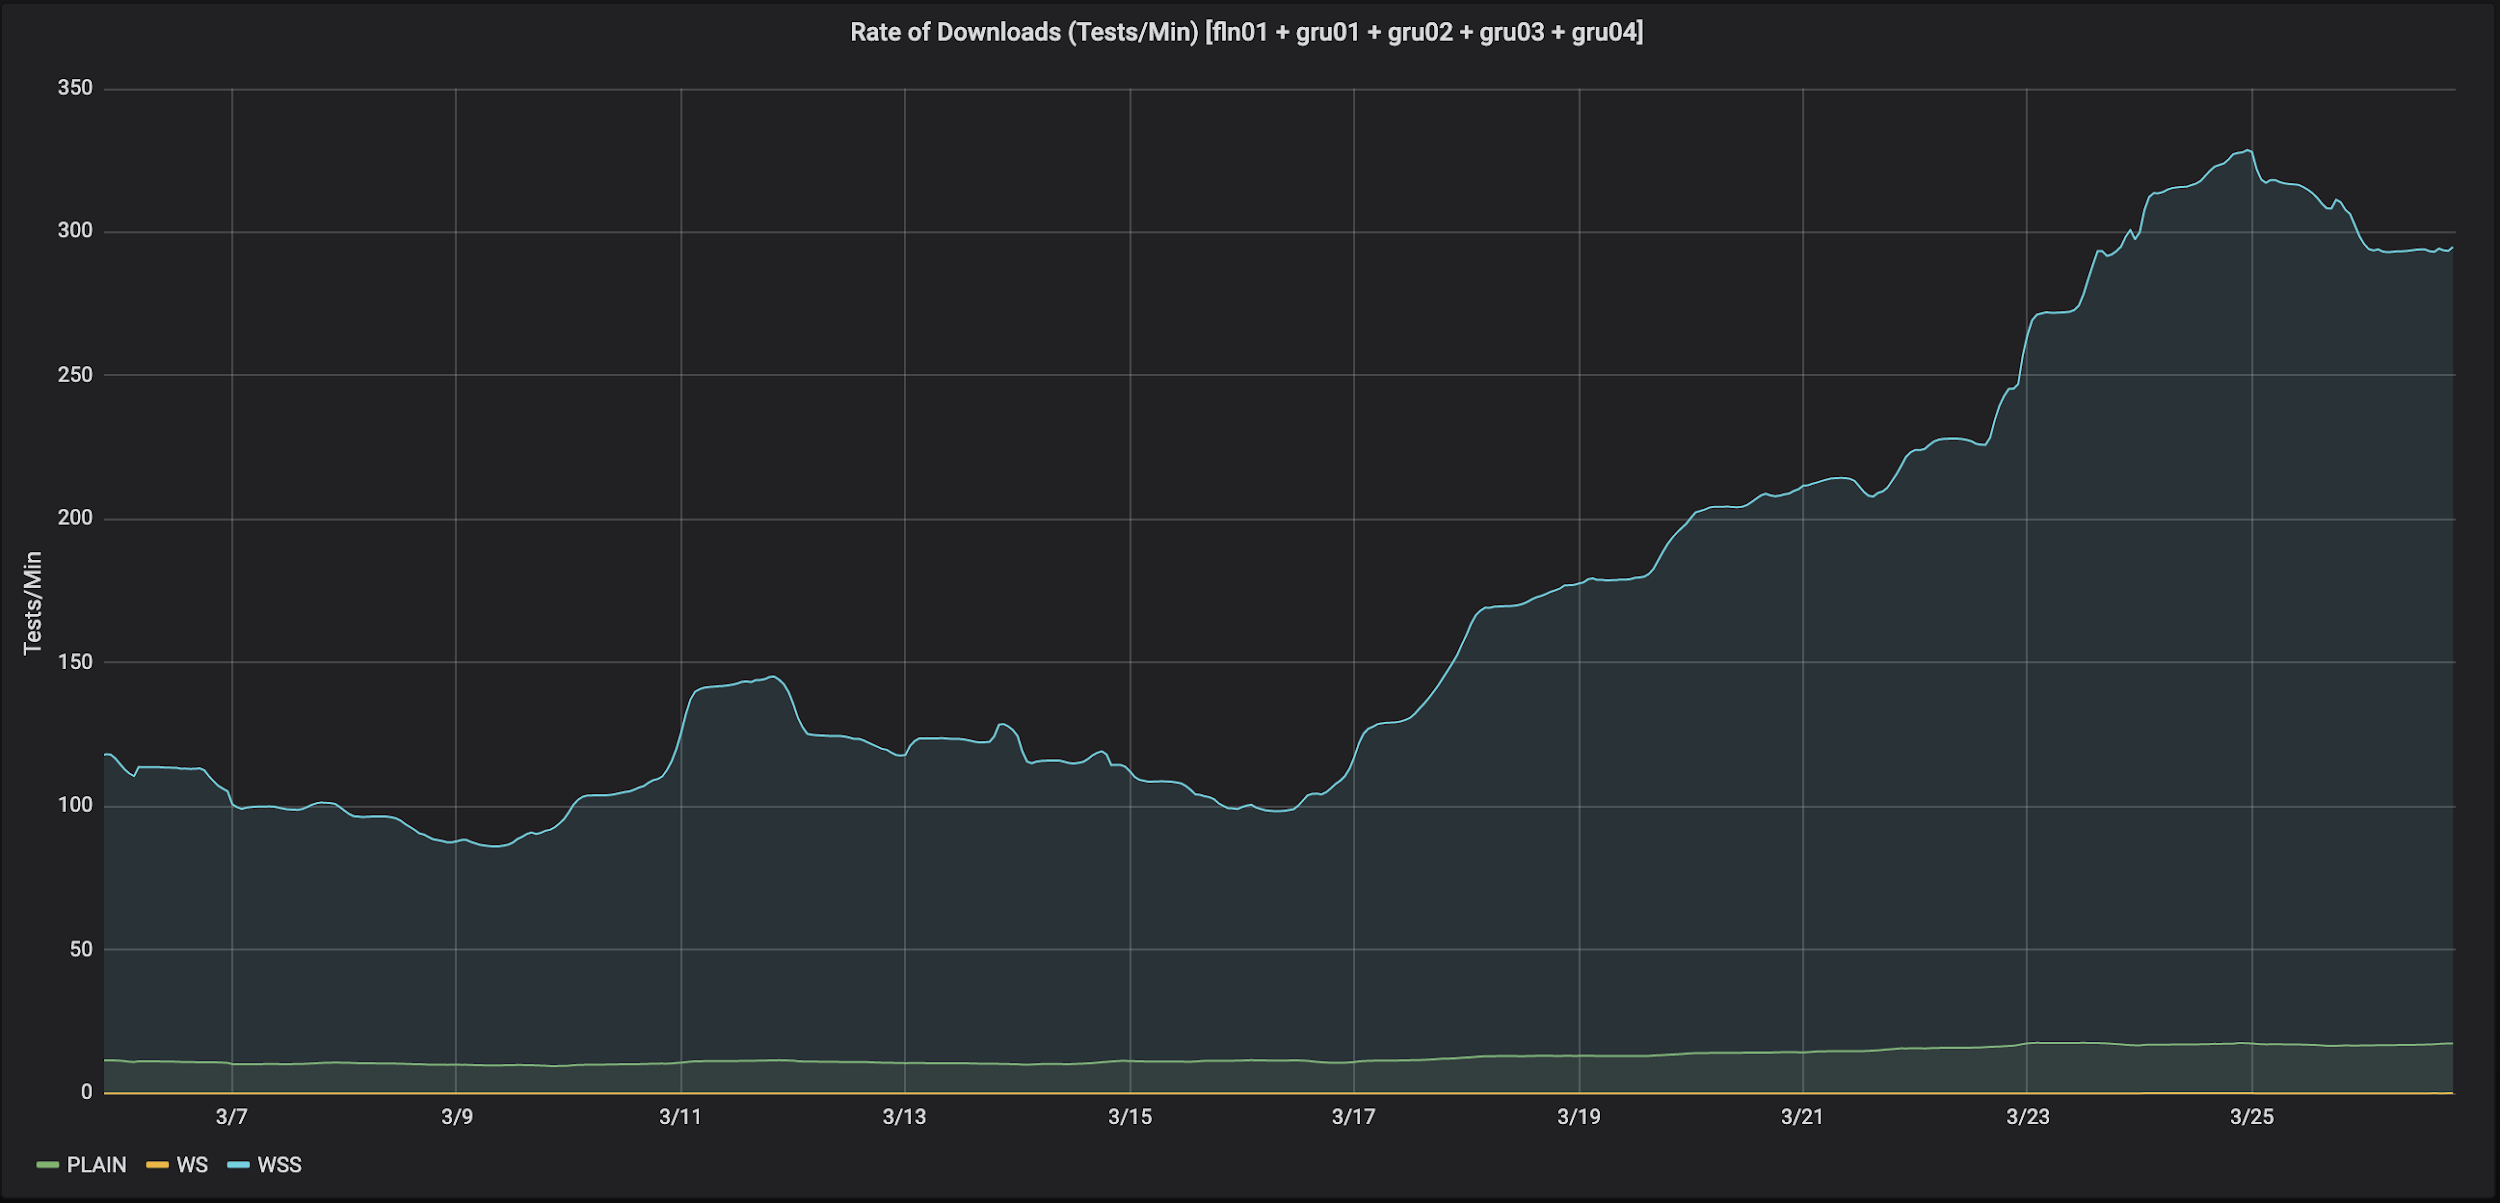 In Brazil, most PLAIN tests are using an interactive client (not automation, as in the US), so the WSS and PLAIN tests experience the same daily variation as people use the network more during the day and less at night.
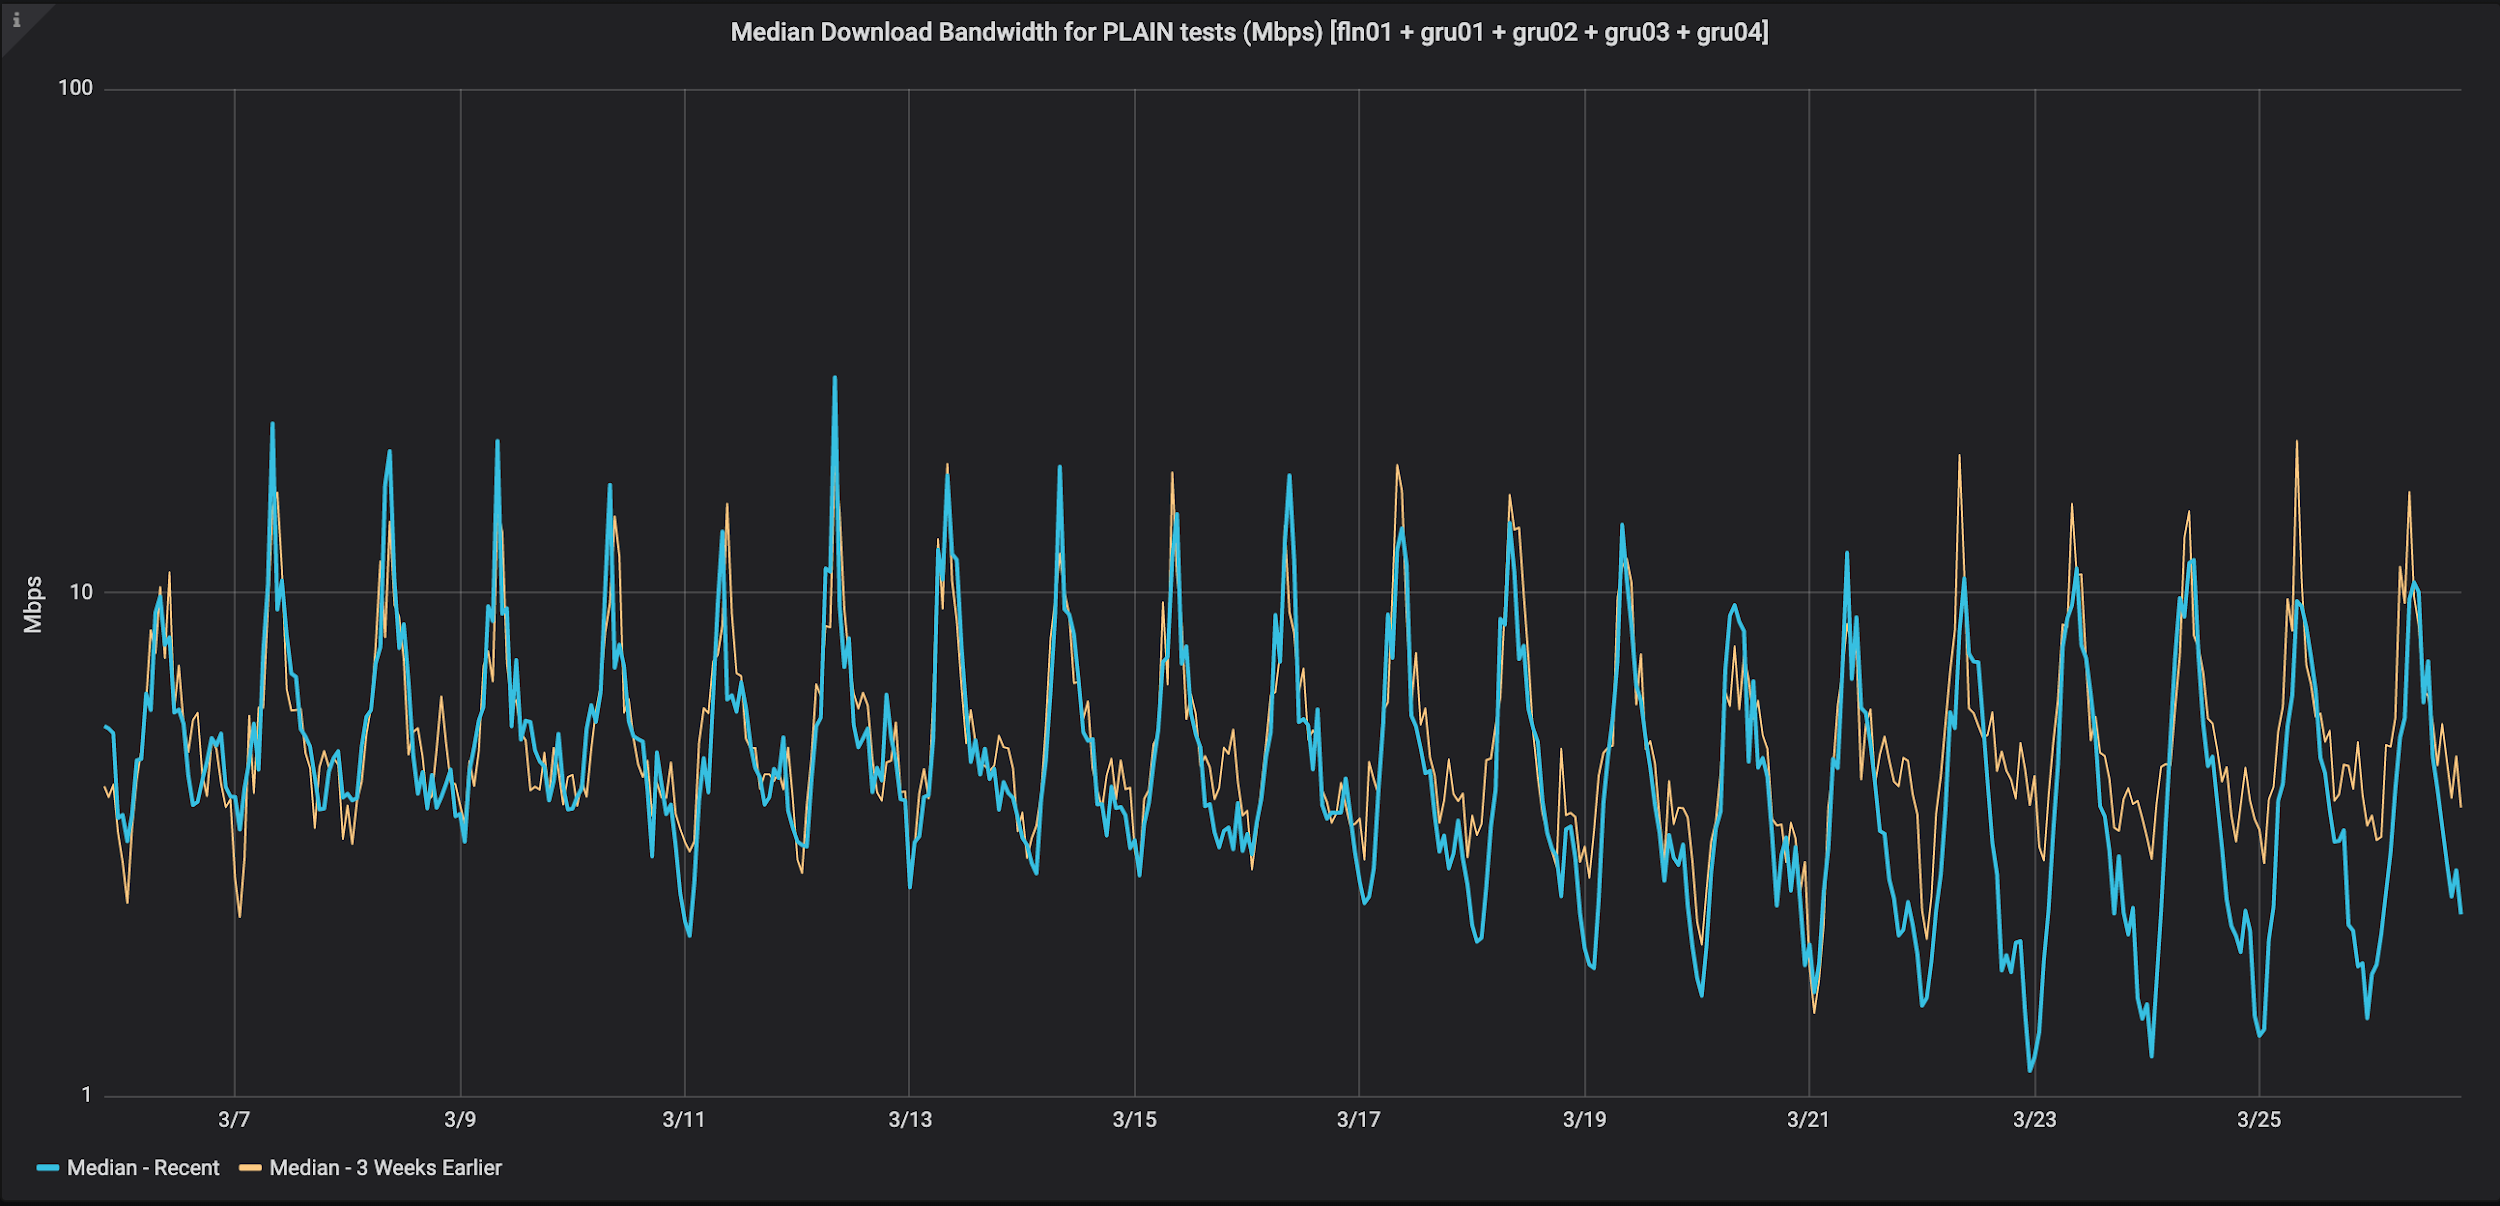 Median Download Bandwidth for PLAIN tests (Mbps):
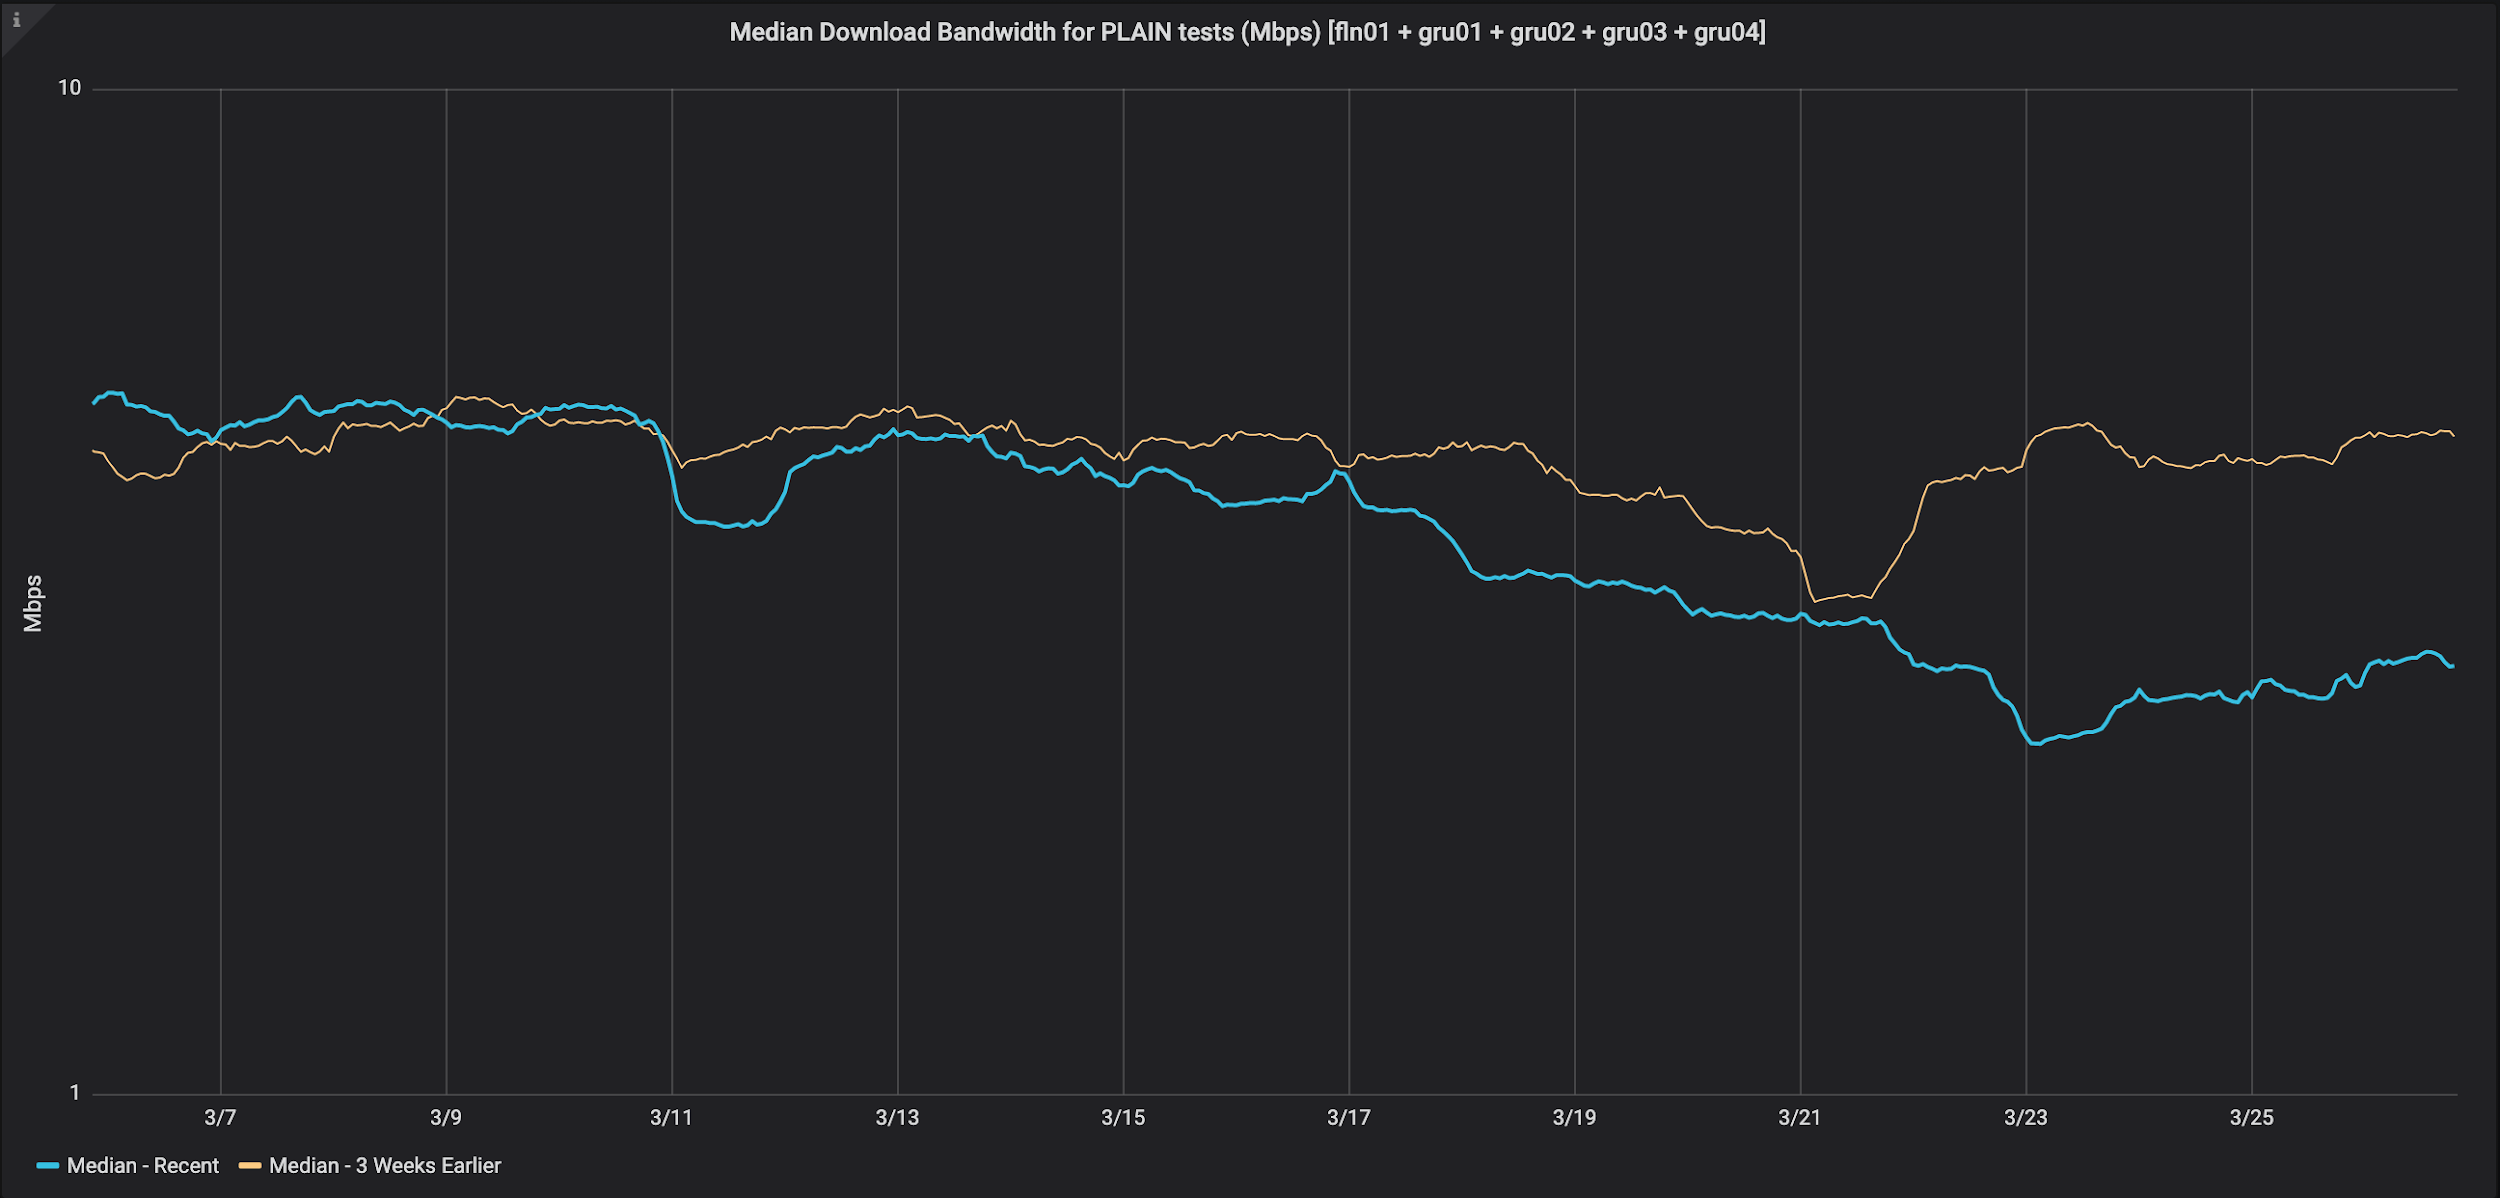
The points of lowest performance between March 23rd and March 25th correspond to the periods of highest demand. And, compared to 3 weeks earlier, recent performance has dropped from 4 to 2 Mbps, almost 50% during peak periods.
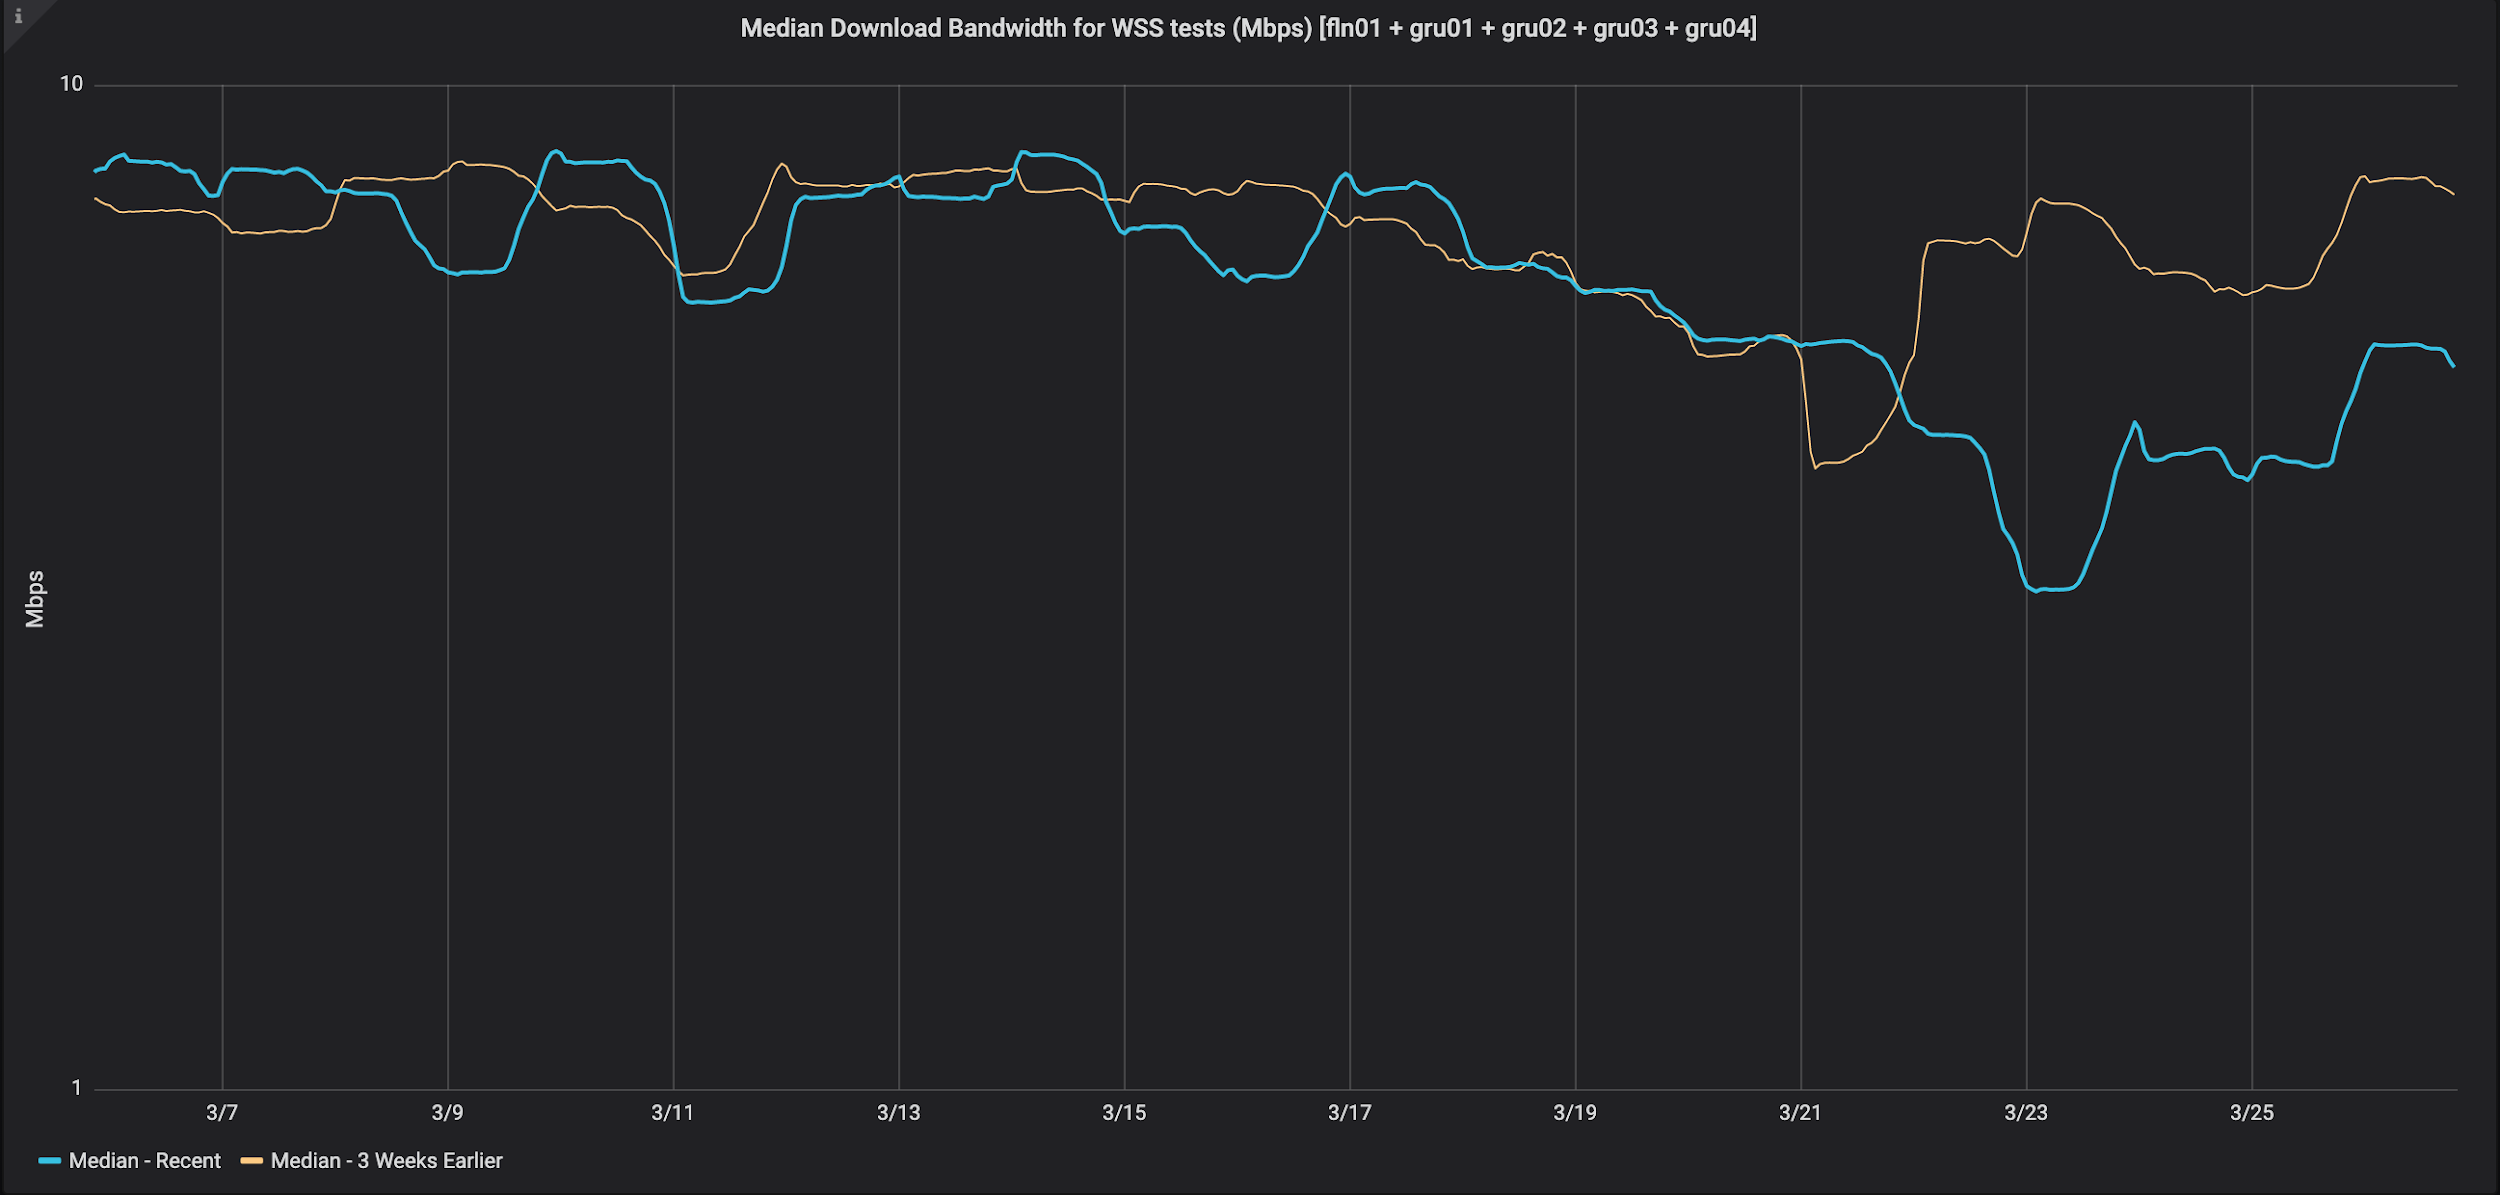
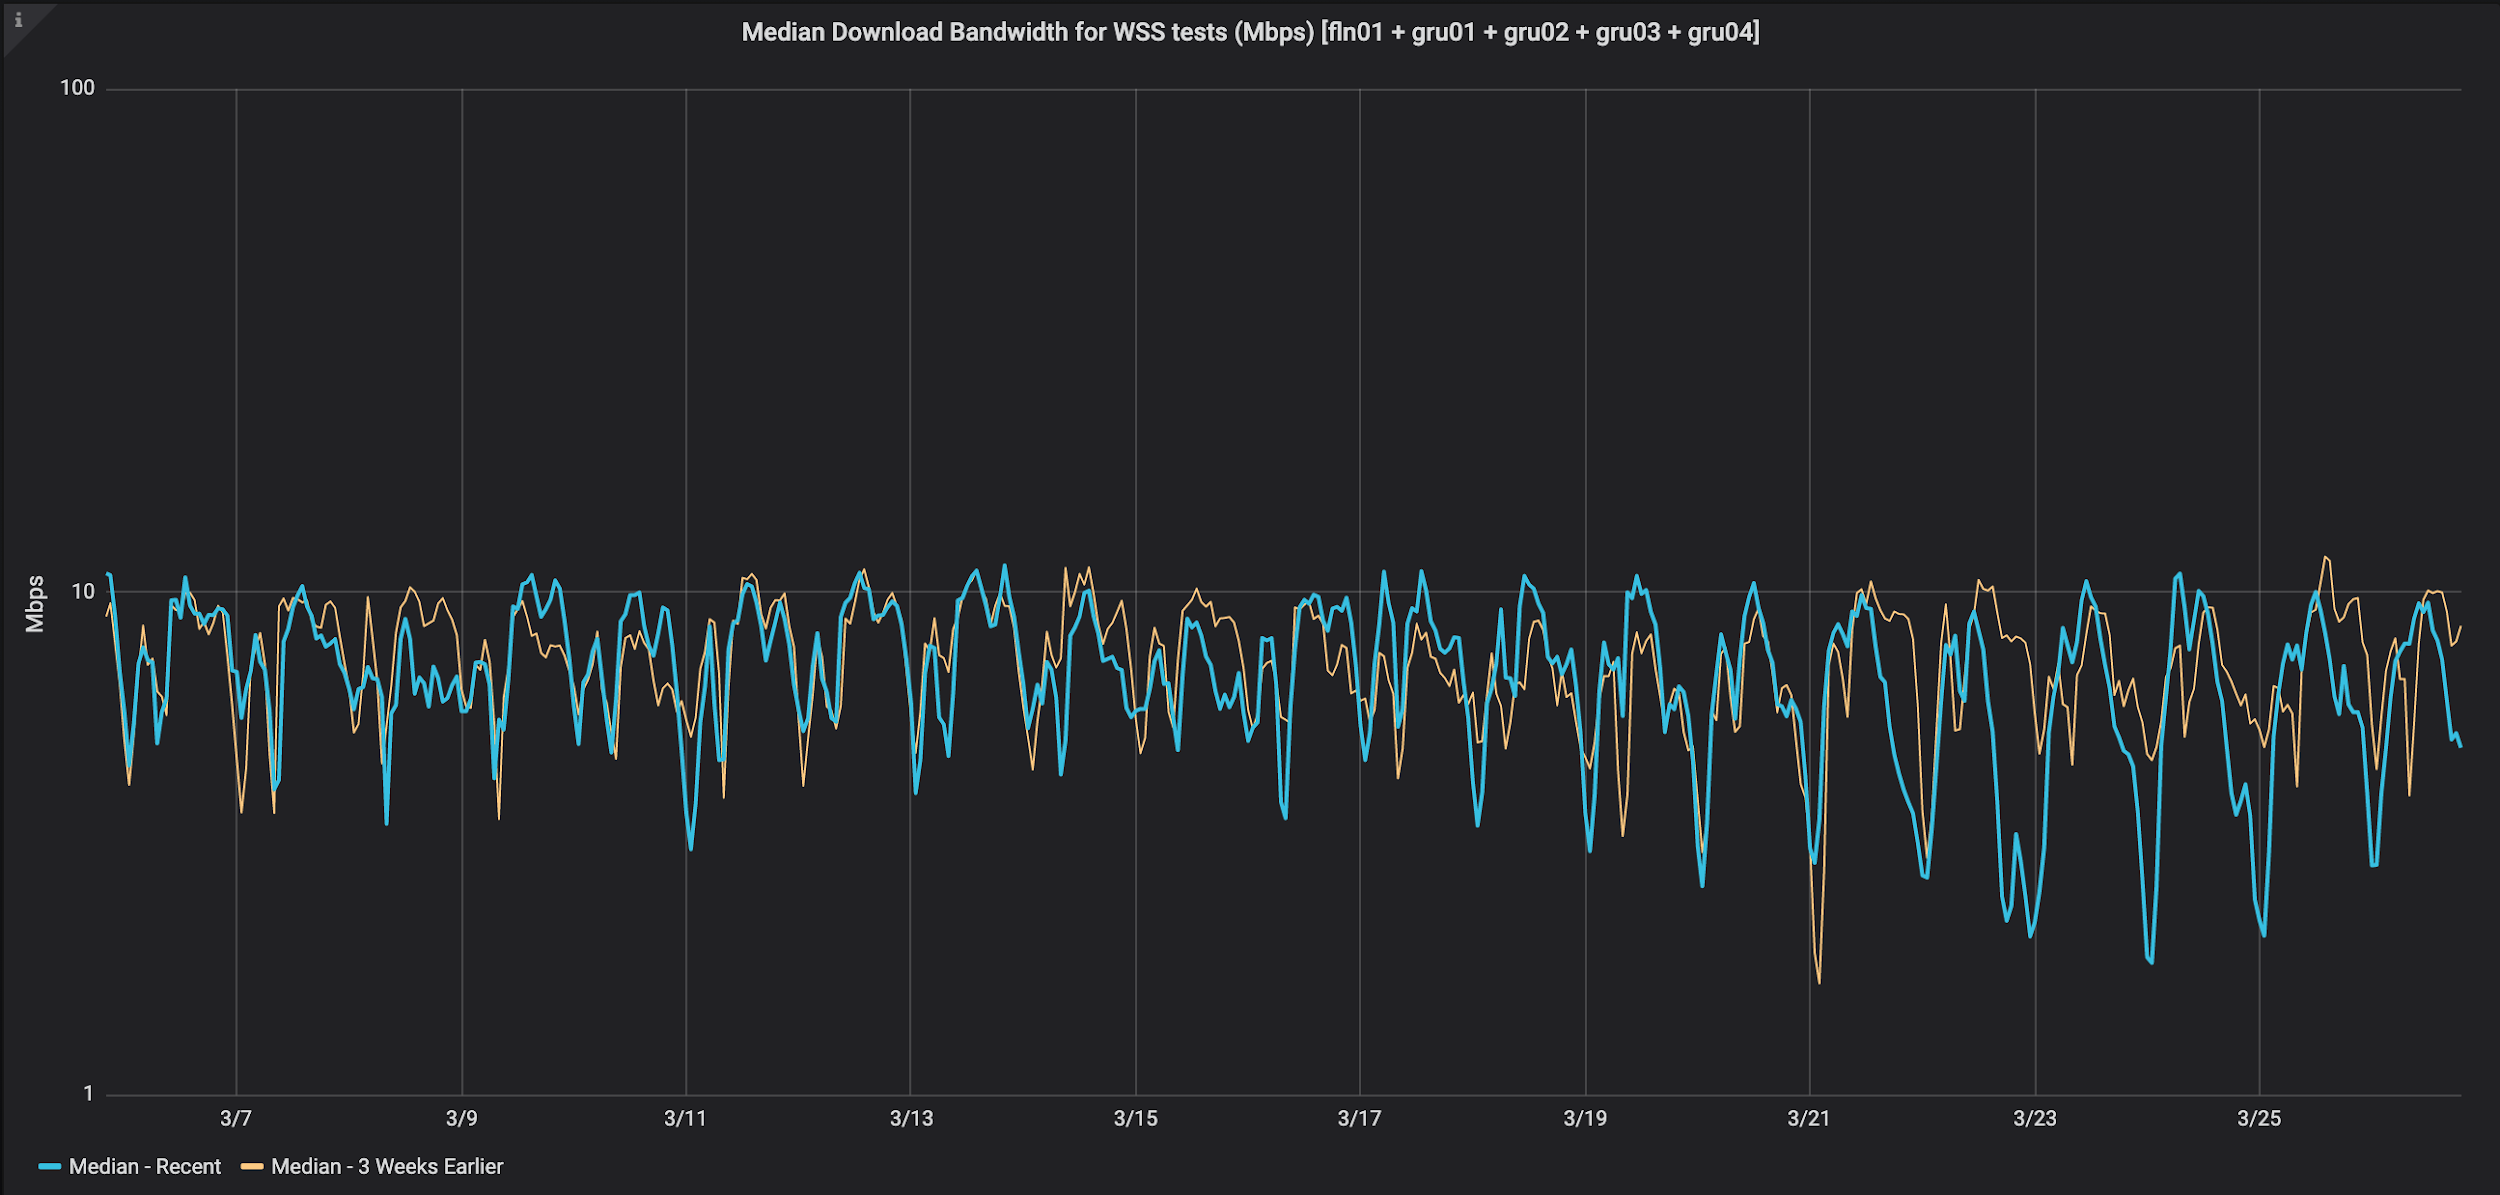 Median Download Bandwidth for WSS tests (Mbps): The points of lowest performance between March 23rd and March 25th correspond to the periods of highest demand. Compared to 3 weeks earlier, the download performance has dropped.
Conclusion
While the above analysis does not provide a conclusive understanding of the entire Internet at this time, the data shows that more people are testing their Internet and that some networks are showing a decreased performance from their usual behavior.
Please continue to check back on our website for more COVID-19 related Internet research. We’ll be publishing new data, dashboards, and analyses as we complete them.
Are you doing research with M-Lab data?
As you all keep testing, we’ll keep our infrastructure open and healthy and keep publishing the data as we always do. If you are doing interesting analysis with M-Lab, please reach out and share it to contact@measurementlab.net or tag us on Twitter @measurementlab.